If we need to ensure that Pods will be scheduled on all or some GKE nodes, we can use the DaemonSet deployment type. When a new node is added to the cluster, Pods are scheduled on them.
The most typical use cases of a DaemonSet are outlined here:
- Using cluster storage daemon on nodes
- Using log collection daemon on nodes
- Using monitoring daemon on nodes
Jobs
A Job deployment type is used to track the successful completion of Pods. Once the specified number of completions is achieved, the job is complete, and it cleans created Pods.
One example of a Job deployment type can be π number computation up to the desired number of places, which in this case is 2000:
ApiVersion: batch/v1
kind: Job
metadata:
name: pi
spec:
template:
spec:
containers:
– name: pi
image: perl:5.34.0
command: [“perl”, “-Mbignum=bpi”, “-wle”, “print bpi(2000)”]
restartPolicy: Never
backoffLimit: 4
Once a Job is created, we can check the Job status by using the kubectl describe job pi command, and to see the Job results, we need to check logs. The command to do that is kubectl logs jobs/pi.
The preceding code can be found at https://kubernetes.io/examples/controllers/job.yaml.
CronJob
A CronJob deployment type is useful when we execute a job based on a schedule written in Cron format.
After learning about different Pod deployment types, we will focus on the different operations we can do with Pods. Let’s start with how to view Pods.
Depending on how the application is deployed, it is important to view details of the Pod, how it is configured, and how to troubleshoot some issues.
Cloud console
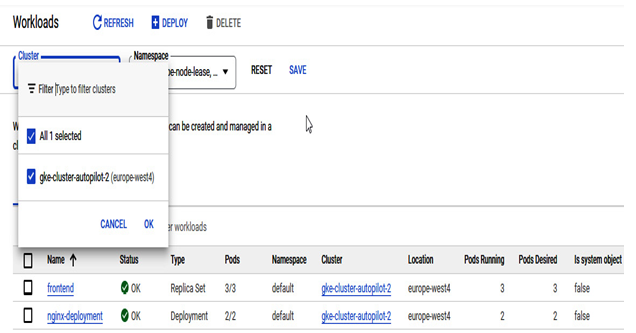
We have some Pods deployed into the GKE cluster, and we can see the status of workloads in Cloud console. Cloudconsole has a general overview of deployed workloads. The main screen allows us to view workloads by selecting a desired cluster or namespace:

Figure 6.27 – Workloads overview in Cloud console
Further on in the bottom section of the screen, we can apply more detailed filtering such as the following:
- Name
- Status
- Type
- Pods
- Namespace
- Location
- Pods running
- Pods desired
- Is system object
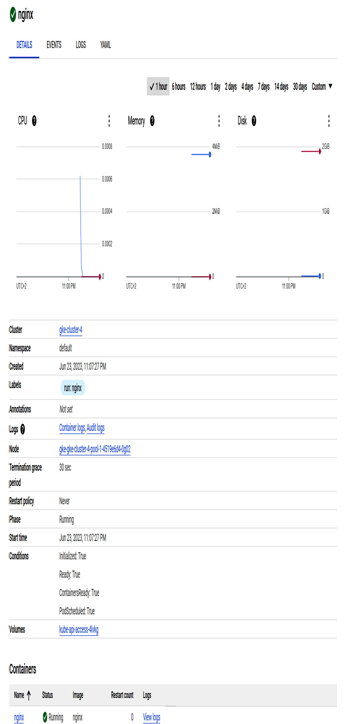
A detailed view of a workload is possible by selecting it from the main workload screen:

Figure 6.28 – Selected workload general overview
The top section of the workload allows us to see workload details, any events that might have occurred, container logs, and your workload represented in YAML format.
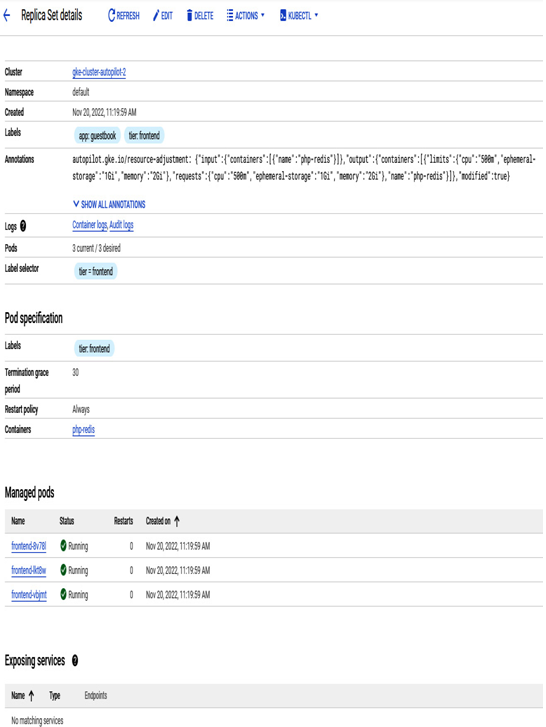
It is possible to go one level deeper and view the details of each of the Pods, which are part of the workload itself:

Figure 6.29 – Detailed view of Pods from the workload
After clicking on the Pod, similar to the general overview of the workload, we can check the Pod’s details and see events, logs, and its YAML representation.
