The GCE network section in Chapter 4 describes what a Compute Engine VM creation task looks like. One of the demonstrated steps was assigning a VM to a VPC subnet and selecting a static/ephemeral public/private IP address for a VM. Once a VM has been created, it can communicate with other VMs in a VPC if firewall rules allow it. Note that a Compute Engine VM can only be deployed in a region where a local subnet exists.
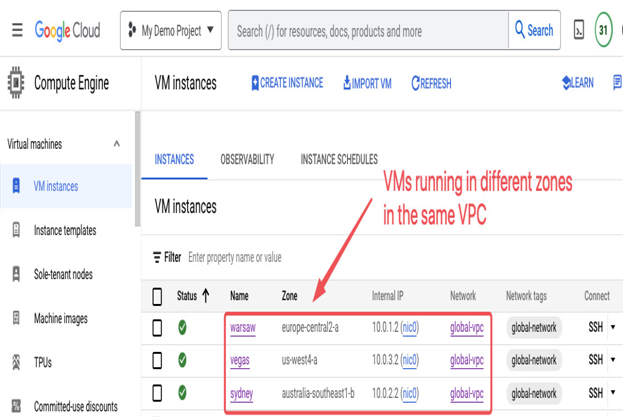
In Figure 9.4, there are three VMs named warsaw, vegas, and sydney that have been deployed in different regions of global-vpc. The following screenshot provides a Google Cloud Console view of their deployment:

Figure 9.5 – Compute Engine VMs in global-vpc
Once a firewall rule has been set up to accept ICMP and TCP traffic within VMs with a global-network tag (network tags will be described later in this chapter in the Securing cloud networks with firewall rules section), we can open an SSH session to one of the VMs and ping the other two. The following screenshot shows a console view for the sydney VM. The output of a traceroute command to the vegas VM and the warsaw VM shows that they are just a single hop away. Although traffic crosses the globe (latency values are a good indicator of the distance between VMs), the network structure for subnets in regions in the same VPC is simple:

Figure 9.6 – Compute Engine VMs that belong to the same VPC are just one hop away from each other, despite being deployed across the globe
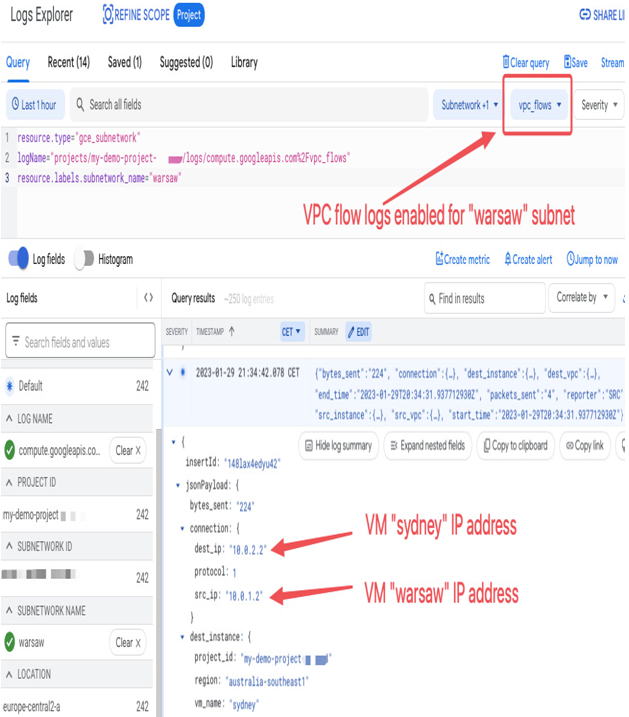
To better understand the behavior of Compute Engine VMs, you can enable VPC Flow Logs on the subnets in which they are deployed. The VPC Flow Logs feature is configured at the subnet level. It takes samples of network flows that can be used for further security analysis or troubleshooting. For example, the following screenshot shows a sample flow that’s been captured between the warsaw and sydney VMs when viewed in Logs Explorer:

Figure 9.7 – The VPC flow logs of the “warsaw” subnet in Logs Explorer showing the “warsaw” VM communicating with the “sydney” VM
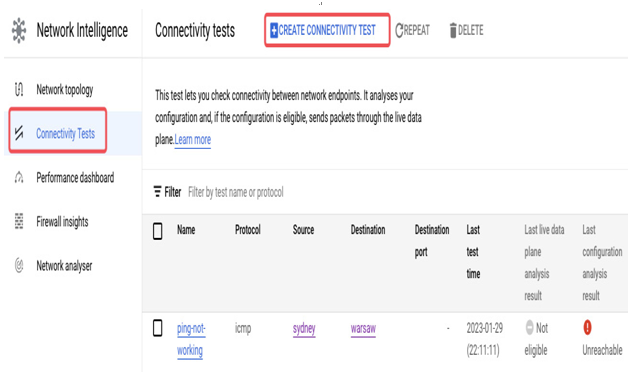
Another useful feature that can be used to analyze and troubleshoot connectivity between VMs is Connectivity Test from the Network Intelligence section:

Figure 9.8 – The Connectivity Test view with a test that verifies if the ping sent from the “sydney” VM can reach the “warsaw” VM
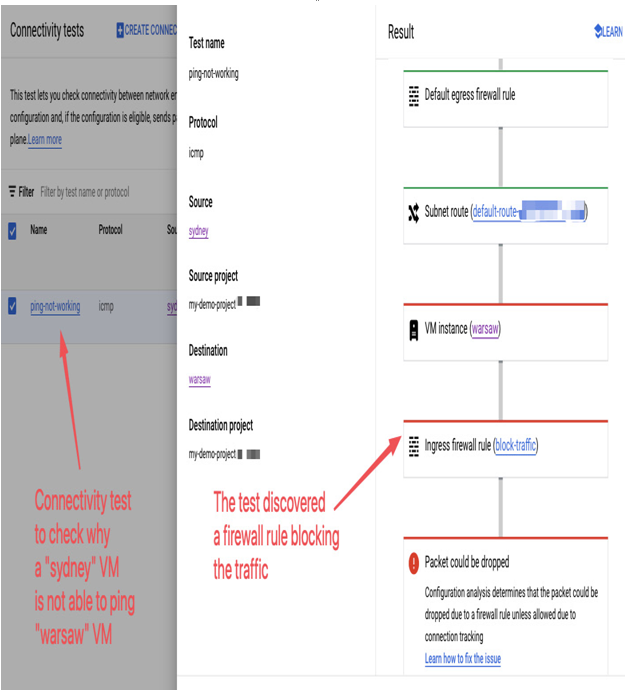
When creating a Connectivity Test view, you must define the protocol that you want to test, such as ICMP, TCP, or UDP. The source endpoint can be, among others, an IP address, a VM, App Engine, Cloud SQL, a GKE cluster control plane or Cloud Run, a destination endpoint, or a port number. Then, Connectivity Test checks the configuration between endpoints and sends packets to check if the communication is working. As a result, you either get a confirmation that the test was successful or a possible reason for failing. For example, the following screenshot presents a failed ping test, where traffic was dropped because of a block-traffic firewall rule:

Figure 9.9 – The result of Connectivity Test shows it is a firewall rule that blocks communication between VMs
Setting up connectivity for Compute Engine VMs can seem to be difficult, especially if you’re just starting. With different subnets and multiple firewall rules to deal with, it’s easy to feel overwhelmed. Thankfully, there are tools such as VPC Flow Logs and Connectivity Center that can provide valuable insights into any potential issues. This makes it much easier to troubleshoot any problems you may encounter.
