We configured a sink to route logs to a new log bucket in the previous section. Log buckets are the default choice for storing logs. It is also possible to route all or a subset of logs to alternative locations for longer retention (Google Cloud Storage), in-depth analysis (BigQuery), or third-party applications (in the cloud or on-premises).
When creating an alternative sink destination, one of the possible options is to send logs to a Cloud Storage bucket. Please note that a Cloud Storage bucket is a different destination from a Cloud Logging bucket. It is also not a real-time service because logs are written in hourly batches to Cloud Storage buckets.
If you want to export the logs to a third-party application that runs in the cloud or on-premises, you should use a Google Cloud Pub/Sub topic as the destination for your log sink. If there is network reachability between your application and your project and the required permissions, log files will populate in the configured Pub/Sub topic. Once you configure your application to pull messages from the Pub/Sub subscriptions, logs will be ingested to their final destination:
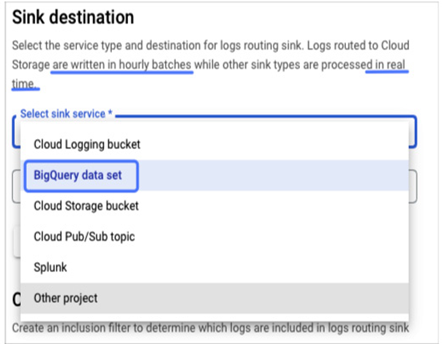
Figure 11.35 – Available services for a log sink
Let’s configure a sink to export logs to an external system for further analysis. In this example, we will export them to BigQuery, so we need to create a data set in the BigQuery section, as illustrated in the following screenshot:
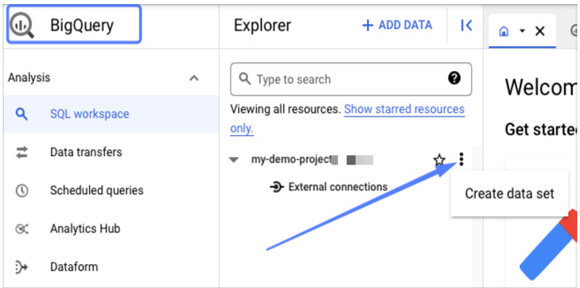
Figure 11.36 – Creating a new BigQuery data set
Creating a new data set includes providing its ID and preferred location. We will reference the ID when creating a new log sink:
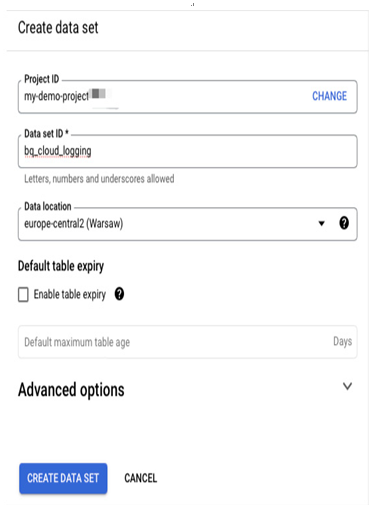
Figure 11.37 – Set up a name and location for a new BigQuery data set
We created a log sink for a log bucket in the previous section. In a similar way, we can create a log sink for a BigQuery data set:
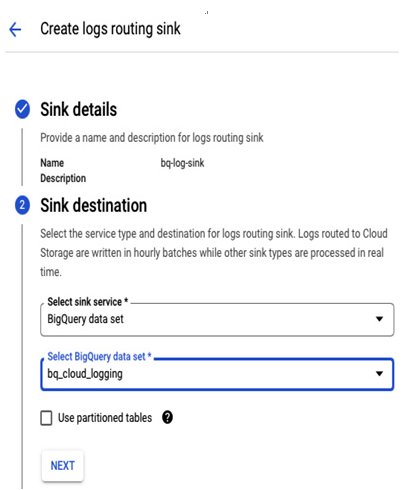
Figure 11.38 – Configuring a BigQuery data set as a log destination
We don’t want to send all the logs to a data set, so we build an inclusion filter. The example filter will send only the logs related to a startup of a Compute Engine VM to Big Query. You can practice creating inclusion filters by building queries in Logs Explorer. If the query returns correct log entries, it can be copied and used as an inclusion filter:
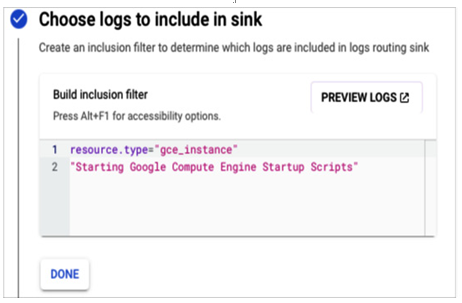
Figure 11.39 – Example inclusion filter that includes only logs related to a VM startup
After creating the sink, we can check whether logs are sent to the BigQuery data set. If you don’t know how to start a query, select the data set and then Query.
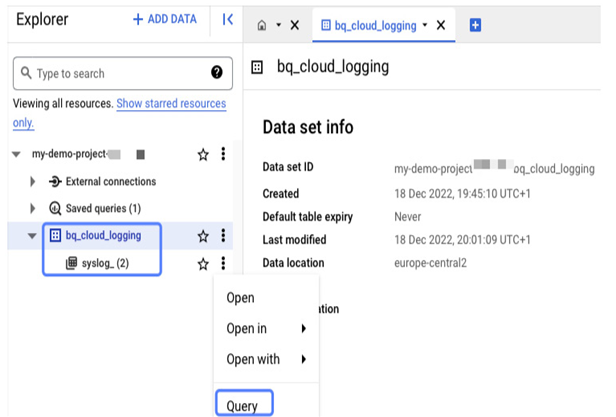
Figure 11.40 – How to query a data set
It will open an editor with a simple query that will look like this one:
SELECT * FROM `my-demo-project-xxx.bq_cloud_logging.syslog_20221219` LIMIT 1000
You can run it to see how the data set is organized and create a more precise one later:
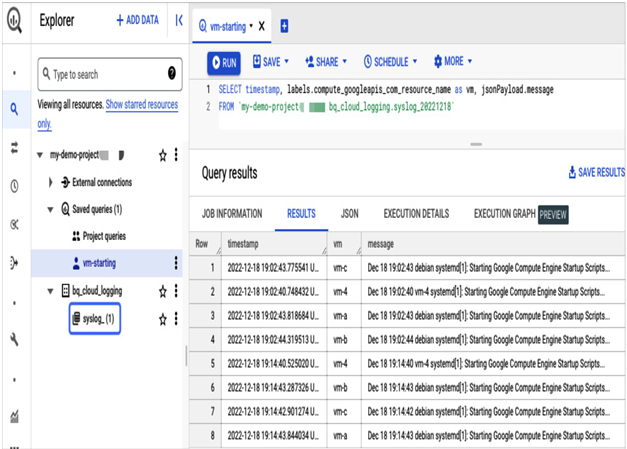
Figure 11.41 – A query that lists imported VM startup entries
In Figure 11.41, we can see a screenshot of the Big Query Explorer view that confirms the successful routing of logs to BigQuery and correct filtering. Only entries related to Compute Engine startup operation are displayed, as intended. Cloud Logging is a highly effective tool for in-depth troubleshooting of workloads. In the upcoming section, we will explore other tools that can aid in troubleshooting.
Google Cloud Monitoring and Logging will help you to make data-driven decisions to shape your application. Knowing how many underlying resources it uses, its current health state, and what type of errors it generates is critical for service availability and future improvements.
But there is more to what the Google Cloud operations suite can offer. This section will describe the additional operations suite services that help with application diagnostics for further improvements and troubleshooting. This is essential, particularly for serverless applications. For this type of system, monitoring the underlying platform is challenging, and browsing through platform logs to understand a user’s experience can also be tricky. Tools such as Trace and Profiler can help immensely here.
