It is possible to diagnose an issue caused by a code in your application using Cloud Monitoring alone. Still, you will have to somehow go from metrics to the request and logs that generated that metric’s data point. Also, examining logs from a web service in Logs Explorer to track the most common errors would be doable but time-consuming. Therefore, this section will focus on dedicated Google Cloud observability tools that address those issues.
Error Reporting
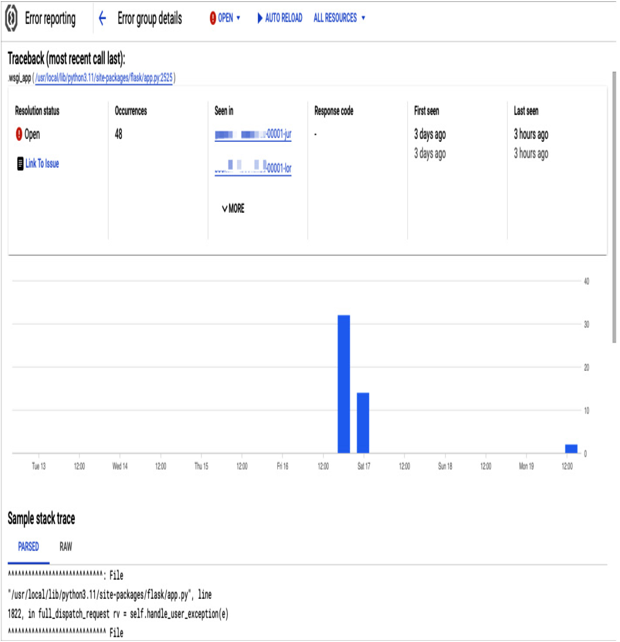
The Error Reporting service runs through the logs collected from your systems, automatically identifying the most common errors for your applications. As a result, just by looking at a dashboard, you can tell when errors started emerging, how many users were impacted, and which part of the code those issues are coming from.
Google Cloud services such as App Engine, Compute Engine, Cloud Functions, Cloud Run, and GKE have Error Reporting automatically enabled. This means that you do not have to configure anything to gain better insight into how your applications are performing.
If you wish to utilize Error Reporting for an application that does not run on any of the mentioned services, it is necessary to send the logs to Cloud Logging in a particular format. Cloud Logging will automatically enable Error Reporting when a user log that meets any of the supported patterns is ingested. Refer to this document to understand how to structure the log entry for your application:
https://cloud.google.com/error-reporting/docs/formatting-error-messages

Figure 11.42 – Error reporting view for an example application
The preceding screenshot shows the Error reporting section for a Cloud Run application. Cloud Run is integrated with Error Reporting, so there is no need for any additional configuration. You can see which revision of Cloud Run is causing errors, when they occurred, and how many errors there were, and the corresponding code is presented at the bottom of this view.
Trace
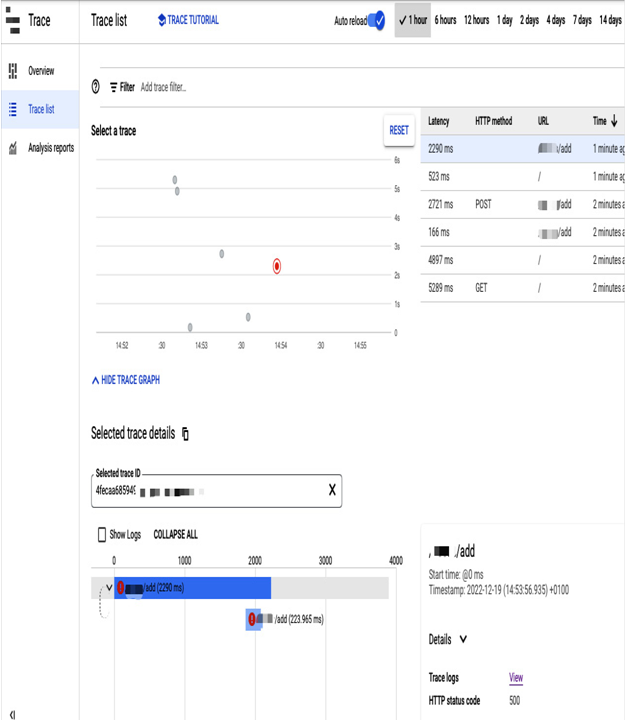
If you want to improve the performance of your applications and provide your users with a better experience, you can use Google Cloud Trace. This tool helps you identify the areas of your application that cause delays, so you can focus on optimizing those components and reducing overall latency.
It works by default with Google-managed services such as Cloud Run, Cloud Functions, and App Engine, but it is also available as a Trace API and SDK for Java, Node.js, Ruby, and Go to be used inside a Compute Engine VM or even outside Google Cloud. By using Trace, you can track potential bottlenecks and issues in your applications:

Figure 11.43 – Trace view for an example application
Trace will help you understand your service’s topology and its flow of requests. In addition, it is responsible for monitoring calls to services and measuring the time it takes for each call to finalize.
Profiler
Google Cloud Profiler helps developers to understand their code’s performance characteristics and identify what parts of their application consume the most resources. It continuously collects CPU usage and memory-allocation information from applications with a low-overhead Profiler package imported into their code (Java, Go, Node.js, and Python are supported). Profiler data can be sent to a Google Cloud project, even from another cloud or on-premises. The results of code performance analysis can be used to improve the speed and reduce the costs of an application.

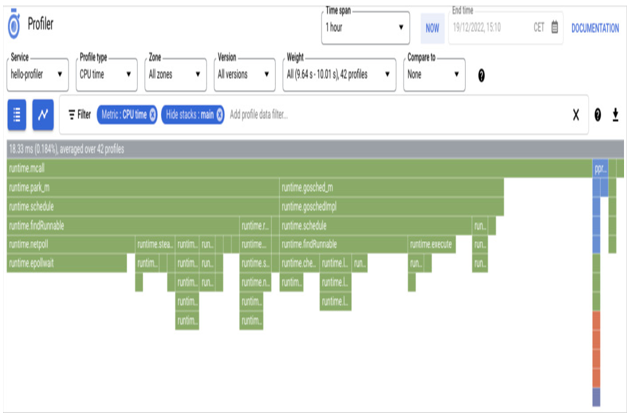
Figure 11.44 – A flame graph in the Profiler view
The preceding screenshot shows a Profiler view with a flame graph. Each frame in the graph represents a function in the code, and its relative size shows this function’s resource consumption proportion. Looking at the graph, you can see the resource usage patterns and potential hotspots of library functions in this demo application.
Debugger
Cloud Debugger (unfortunately planned to shut down in the middle of 2023 and be replaced by an open source CLI tool called Snapshot Debugger: https://github.com/GoogleCloudPlatform/snapshot-debugger) allows you to inspect what is happening in the code of a running application. For example, suppose you located an error in your production application thanks to Error Tracking and examined the corresponding logs in Logs Explorer. Now you have precise information on what line of your code should be examined. As a next step, you can use Debugger to take a snapshot of what is happening in the code in this position and check the details of variables without pausing this service.
