Packet Capture and Protocol Analysis (37.5.2)
Protocol analyzers can investigate packet content while flowing through the network. A protocol analyzer decodes the various protocol layers in a recorded frame and presents this information in a relatively easy-to-use format.
As a technician, you may be tasked to capture traffic from a specific host. Therefore, it is important that you become familiar with the software to complete the assigned task.
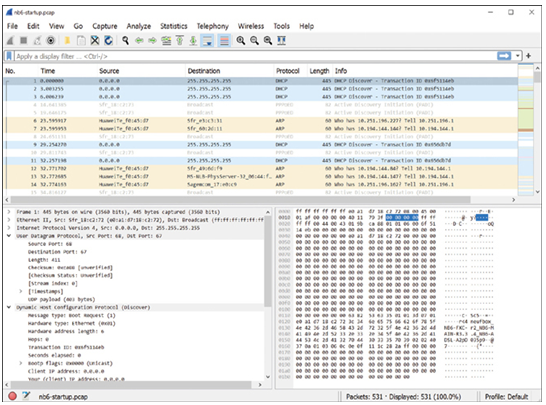
Figure 37-38 shows a screen capture of the Wireshark protocol analyzer.

Figure 37-38 Example of Viewing a Wireshark Capture
The information displayed by a protocol analyzer includes the physical layer bit data, data link layer information, protocols, and descriptions for each frame. Most protocol analyzers can filter traffic that meets certain criteria so that all traffic to and from a device can be captured. Protocol analyzers such as Wireshark can help troubleshoot network performance problems. It is important to have both a good understanding of TCP/IP and how to use a protocol analyzer to inspect information at each TCP/IP layer.
Lab—Install Wireshark (37.5.3)
Wireshark is a software protocol analyzer, or “packet sniffer” application, used for network troubleshooting, analysis, software and protocol development, and education. Wireshark is used throughout the course to demonstrate network concepts. In this lab, you will download and install Wireshark.
Refer to the online course to complete this lab.
Lab—Use Network Tools to Learn About a Network (37.5.4)
Wireshark is a software protocol analyzer, or “packet sniffer” application, used for network troubleshooting, analysis, software and protocol development, and education. Wireshark is used in this course to demonstrate network concepts. Nmap is a popular network scanning and mapping tool. In this lab, you use Nmap to discover hosts on your network and then use Wireshark to capture traffic between your computer and other hosts.
Refer to the online course to complete this lab.
Measuring Network Throughput (37.5.5)
Bandwidth and throughput are two terms that are commonly used when describing the amount of traffic flowing between two devices.
Bandwidth is the theoretical amount of data that can be transmitted from one device to another in an amount of time. Bandwidth is typically measured in the number of bits per second.
Throughput is the measurement of the actual number of bits per second that are being transmitted across the media. Throughput is always lower than the specified bandwidth because traffic can encounter latency or delay during transmission.
Latency may be caused by any number of issues specifically the physical distance between the source and destination. There are other factors as well, including the number of network devices encountered between source and destination. As data crosses multiple networks, it must be processed and forwarded by switches and routers.
A technician might need to verify the throughput of a link to verify its operation. There are many sites on the Internet that we can use to do so. Searching using internet speed test will provide several websites that will measure the connection “speed” and performance of your connected device to the Internet. These sites typically use preselected servers and report both your downloading and upload “speeds.”
iPerf is a downloadable Windows tool to measure throughput between a client and a server. iPerf is required to be running on both end devices. Example 37-12 shows the throughput between a client and public iPerf server, speedtest.masnet.ec.
Example 37-12 Output for the iperf Command
C:\tools\iperf>
iperf3 -c speedtest.masnet.ec
Connecting to host speedtest.masnet.ec, port 5201
[ 7] local 10.0.0.129 port 58350 connected to 170.83.216.19 port 5201
[ ID] Interval Transfer Bitrate
[ 7] 0.00-1.00 sec 576 KBytes 4.72 Mbits/sec
[ 7] 1.00-2.00 sec 393 KBytes 3.22 Mbits/sec
[ 7] 2.00-3.00 sec 775 KBytes 6.35 Mbits/sec
[ 7] 3.00-4.00 sec 713 KBytes 5.83 Mbits/sec
[ 7] 4.00-5.00 sec 677 KBytes 5.55 Mbits/sec
[ 7] 5.00-6.00 sec 701 KBytes 5.75 Mbits/sec
[ 7] 6.00-7.00 sec 718 KBytes 5.89 Mbits/sec
[ 7] 7.00-8.00 sec 621 KBytes 5.08 Mbits/sec
[ 7] 8.00-9.00 sec 749 KBytes 6.13 Mbits/sec
[ 7] 9.00-10.00 sec 738 KBytes 6.05 Mbits/sec
[ ID] Interval Transfer Bitrate
[ 7] 0.00-10.00 sec 6.50 MBytes 5.46 Mbits/sec sender
[ 7] 0.00-10.18 sec 6.38 MBytes 5.26 Mbits/sec receiver
iperf Done.
C:\tools\iperf>
The relevant output is
- Interval—The time interval iPerf periodically reports throughput. By default, the time interval is 1 second.
- Transfer—The amount of data transferred during each time interval.
- Bitrate—The measured throughput in in each time interval.
Packet Tracer—Troubleshooting Challenge—Use Documentation to Solve Issues (37.5.6)
In this Packet Tracer activity, you use network documentation to identify and fix network communications problems.
- Use various techniques and tools to identify connectivity issues.
- Use documentation to guide troubleshooting efforts.
- Identify specific network problems.
- Implement solutions to network communication problems.
- Verify network operation.
Refer to the online course to complete this Packet Tracer.
