We need three steps to achieve the same configuration we did using the Cloud console.
The first section creates an MIG based on a pre-configured template:
gcloud beta compute instance-groups managed create INSTANCE_GROUP_NAME –project=PROJECT_NAME –base-instance-name=INSTANCE_GROUP_NAME –size=MINIMUM_SIZE –template=TEMPLATE_NAME –zones=ZONE_NAME_X,ZONE_NAME_Y,ZONE_NAME_z –target-distribution-shape=EVEN
To create a named port, we need to execute the following command:
gcloud compute instance-groups managed set-named-ports INSTANCE_GROUP_NAME –project=PROJECT_NAME –region=REGION_NAME named-ports=port:80
In the last section, we configure the autoscaling policy for our MIG:
gcloud beta compute instance-groups managed set-autoscaling INSTANCE_GROUP_NAME –project=PROJECT_NAME –region=REGION_NAME –cool-down-period=COOL-DOWN-PERIOD-IN-MIN –max-num-replicas=MAX_REPLICAS –min-num-replicas=MIN_REPLICAS –mode=on –target-cpu-utilization=0.6 –scale-in-control=max-scaled-in-replicas-percent=10,time-window=600
In the next section, we will cover the autoscaling options for the existing running MIG.
Autoscaling
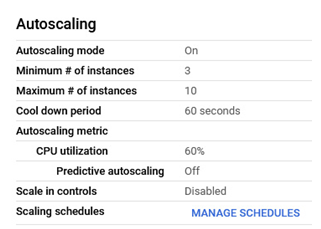
Autoscaling settings are visible in the Details section of the MIG:

Figure 4.77 – Autoscaling information in the MIG
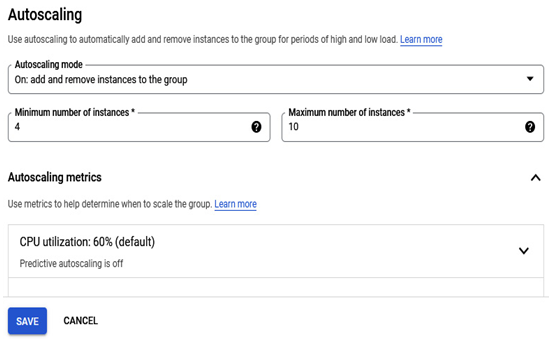
To change the autoscaling setting, we need to click the EDIT button, and then we will be redirected to the configuration window. It looks the same as when we created the MIG. If you wish, you can change the settings and confirm so by clicking the SAVE button:

Figure 4.78 – The autoscaling changes for the MIG in the Cloud console
After clicking the SAVE button, the changes will be applied immediately to the MIG:

Figure 4.79 – A new instance is created after updating the autoscaling settings
The preceding screenshot shows the newly added example after changing the autoscaling settings.
In this section, we covered many topics about VM instances. We learned how to create a new instance, update its configuration, create snapshots, and create MIGs. The following section will focus on logging and monitoring agents and how to install them, and viewing base monitoring metrics.
Cloud logging and monitoring agents
Google Cloud’s operations suite offers two monitoring agents:
- Ops Agent: The primary and preferred agent to collect metrics and logs
- Legacy Monitoring agent: Like Ops Agent, this can gather metrics from the supported operating systems but shouldn’t be used for new deployments
Google’s Ops Agent is a unified telemetry agent that uses Fluent Bit to collect logs and OpenTelemetry to collect metrics.
Fluent Bit is an open source log collector that is used to collect and process logs from a variety of sources. OpenTelemetry is an open source project that provides a unified way to collect telemetry data from applications and services.
By using Fluent Bit and OpenTelemetry, the Ops Agent can collect both logs and metrics from your applications and services. This data can then be used to monitor the health and performance of your applications, troubleshoot problems, and identify performance bottlenecks.
Installing the Ops Agent
The Ops Agent can be installed on many Linux- and Windows-based operating systems.
A complete and up-to-date list is available on the website, and installation will differ depending on the operating system: https://cloud.google.com/stackdriver/docs/solutions/agents/ops-agent#linux_operating_systems.
In this example, we will focus on installing Ubuntu Server 20.04.4 LTS:
- To install the latest version of the Ops Agent, we need to run the following command:
curl -sSO https://dl.google.com/cloudagents/add-google-cloud-ops-agent-repo.sh sudo bash add-google-cloud-ops-agent-repo.sh –also-install
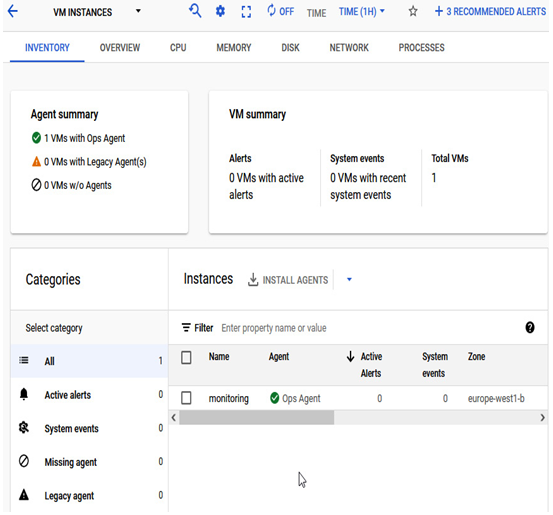
Installation takes a moment, and after a while, in the monitoring section of the Cloud console, the Ops Agent will be detected:

Figure 4.80 – The monitoring and logging Ops Agent installation was successful
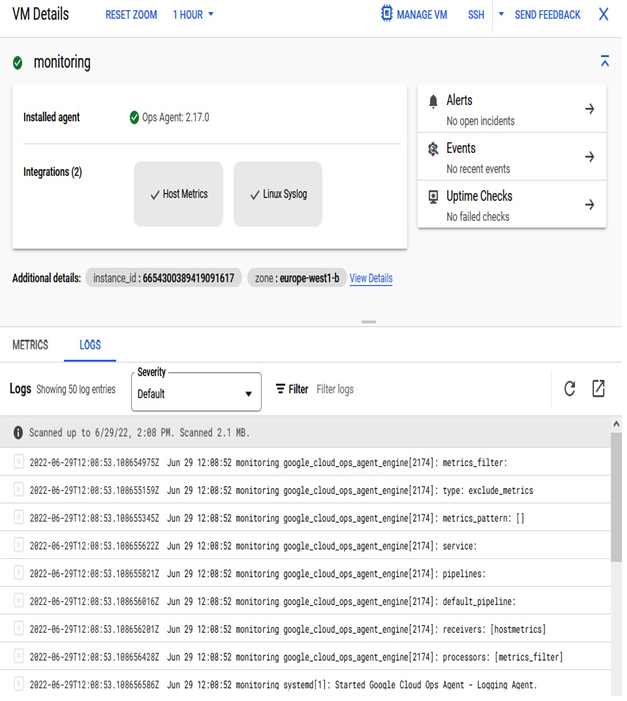
To view the detailed metrics and logs from the instance, we need to click on its name:

Figure 4.81 – The logging view of an instance with the Ops Agent installed
This concludes the installation of the Ops Agent on a Linux server. In the upcoming chapters, we will learn much more about logging and monitoring in Google Cloud.
Understanding GCE takes some time. We covered many topics, from the simplest one, VM creation, to the creation of an MIG. In between, we added and removed disk to instances and created snapshots, which aren’t a backup solution but can be used if something happens and we need to roll back to the previous state of the instance quickly. We briefly touched on the networking of Compute Engine, which will have a dedicated chapter. We ended the chapter by installing cloud logging and monitoring agents, which is important in conjunction with MIGs and autoscaling.
In the next chapter, we will abstract VMs and move up the logical layers, where Kubernetes and Google Kubernetes Engine will play a leading role.
