Configure an Azure load balancer
As discussed earlier, both internal and public load balancers involve the coordinated configu- ration of several groups of settings. These settings work together to define the overall load balancer behavior.
To use Azure Load Balancer, the administrator must first provision the resource, which includes the frontend IP configuration. After this step has been completed, you can create the back-end pool, the heath probes, and finally the load-balancing rule.
To create the load balancer in the Azure portal, search for Load Balancer. On the Load Balancers blade, click Create. This will open the Create Load Balancer blade, as shown in Figure 4-54. Complete the fields:
- Name Provide a name for the load balancer resource.
- SKU Select the pricing tier: Basic, Standard, or Gateway.
- Type Choose Public or Internal.
- Tier Specify whether the load balancer is Regional or Global.
- Subscription, Resource Group, And Location Specify as required.
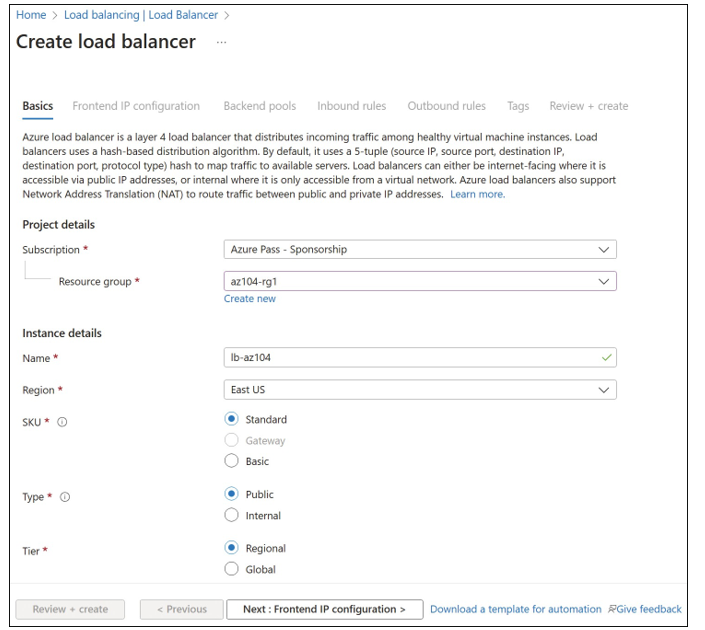
FIGURE 4-54 Creating a public load balancer with the Azure portal
Click Next: Frontend IP configuration. On this tab, click Add A Frontend IP Configuration to configure the frontend IP address, depending on whether the load balancer is set to be a pub- lic or internal appliance. For public load balancers, create and associate the public IP address here. For internal load balancers, select the virtual network and subnet to place the load balancer in. Figure 4-55 displays the public frontend IP configuration, and Figure 4-56 displays the internal frontend IP configuration.
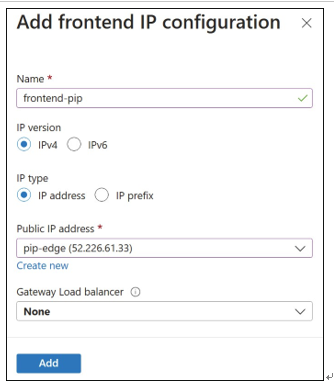
FIGURE 4-55 Public frontend IP configuration
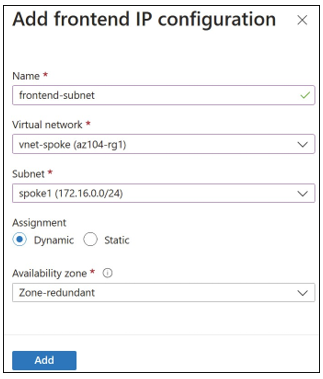
FIGURE 4-56 Internal frontend IP configuration
Click Next: Backend Pools. On the Backend Pools tab, click Add A Backend Pool. A back-end pool is the target of the incoming traffic. Figure 4-57 displays the Add Backend Pool blade using an IP address for the back-end resource.
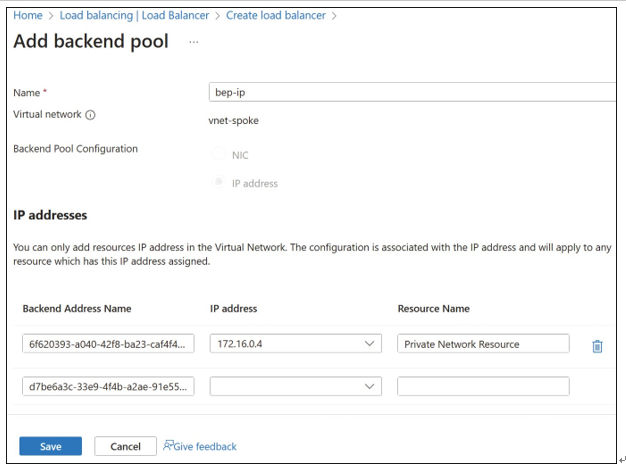
FIGURE 4-57 Back-end pool IP addresses
After configuring the Basics, Frontend IP Configuration, and Backend Pool tabs, you can cre- ate the load balancer. Optionally, you can also configure inbound and outbound rules during creation, but those can also be added after deployment. Click Review + Create, and then click Create to deploy the load balancer.
To create a health probe, navigate to the Load Balancer blade and choose Health Probes, Add. This opens the Add Health Probe blade, as shown in Figure 4-58. Specify the health probe name, together with the protocol, port, probe interval, and consecutive probe failures threshold.
The final step is to configure a load-balancing rule, which links the frontend IP configura- tion to the back-end pool, specifying the health probe and other load-balancing settings. On the Load Balancer blade, choose Load Balancing Rules, Add. This opens the Add Load Balanc- ing Rule blade, as shown in Figure 4-59. Choose the frontend IP configuration, back-end pool, and health probe selected earlier. For HTTP traffic, select TCP, and specify port 80 for both the frontend and back-end ports. Select None for Session Persistence and leave the Idle Timeout value at the default of 4 minutes.

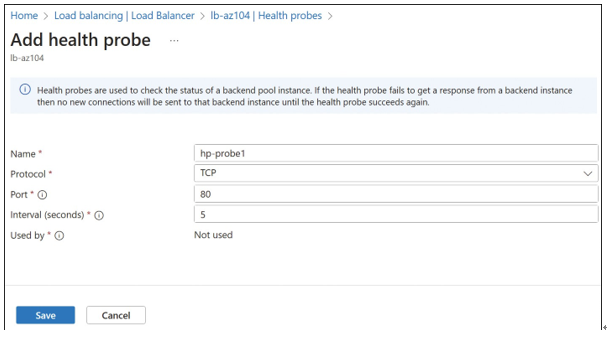
FIGURE 4-58 Creating a health probe in Azure Load Balancer
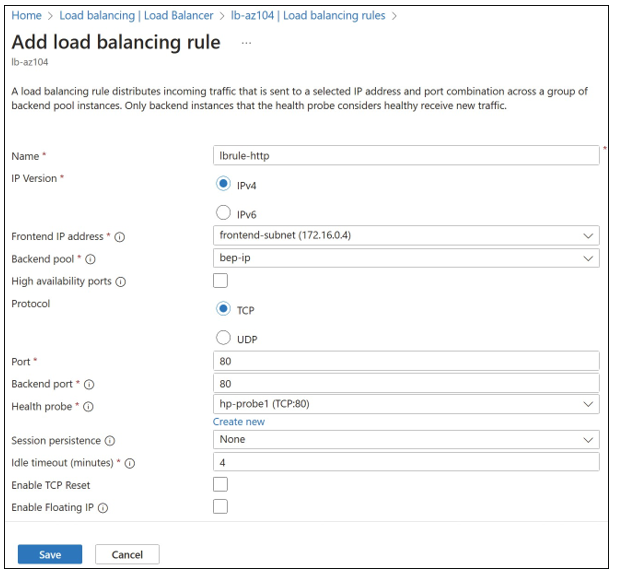
FIGURE 4-59 Creating a load-balancing rule in Azure Load Balancer
The final step is to ensure NSGs are configured to allow incoming traffic and health probe traffic. With this in place, if the VMs added to the back-end pool are configured with a web server, you should be able to connect to the public IP address of the load balancer and see the webpage.
Basic- and Standard-tier load balancers also support additional diagnostic logs to enable com- mon troubleshooting scenarios. These logs are different between the Basic and Standard tiers.
The Basic-tier load balancer does not provide any diagnostic settings to configure. If you need to capture metrics related to a load balancer, you must use a Standard-tier load balancer. Available metrics include byte count, packet count, health probe status, SYN count (for new connections), and more. Azure Monitor supports charting and alerting based on these metrics. In addition, they are exposed as multi-dimensional metrics, meaning that charts and alerts can be built using filtered views.
To enable load-balancer logs, open the Load Balancer blade in the Azure portal, click Diag- nostic Logs, and click Add Diagnostic Setting to open the Diagnostic Setting blade, as shown in Figure 4-60.
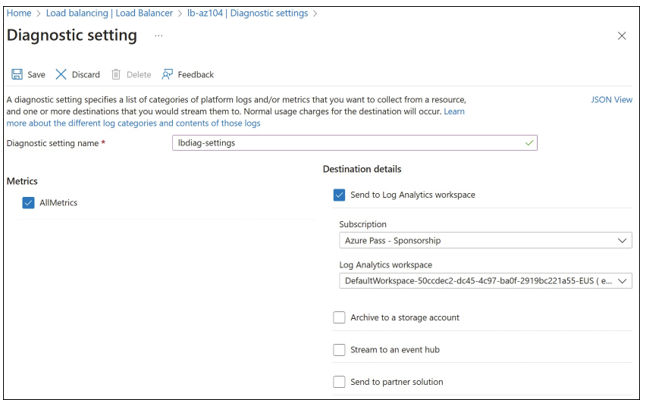
FIGURE 4-60 Configuring diagnostics logs in a load balancer
Once you’ve configured the diagnostics logs, they can be downloaded for offline analysis or analyzed using Log Analytics.
