Configure log settings in Azure Monitor
Log Analytics helps you collect, correlate, search, and act on log and performance data generated by operating systems, applications, and Azure services. It gives you operational insights using rich search and visualizations. Log Analytics provides a single pane of glass for interact- ing with the data from the entire platform and the workloads you host on it including both Linux and Windows servers. Also, Log Analytics can be used with other cloud providers.
Logs are collected and aggregated in a Log Analytics workspace. The logs can also be queried and visualized through Log Analytics or through Azure Monitor. A workspace is an Azure resource, meaning that RBAC can be applied for granular access to the service and the data stored within it. This also means that workspaces can be in regions that meet your organization’s regulatory requirements, data isolation, and scope. You can create multiple workspaces in a single subscription.
Implement Log Analytics workspace
You can create a workspace through the Azure portal, Azure PowerShell, the Azure CLI, and ARM templates. To create a workspace through the Azure portal, search for Log Analytics workspace. Click Create to open the Create Log Analytics Workspace blade.
To configure a workspace, you will need to provide the following (see Figure 5-7):
- A name for the workspace
- The subscription the workspace will be associated with
- A resource group
- A location

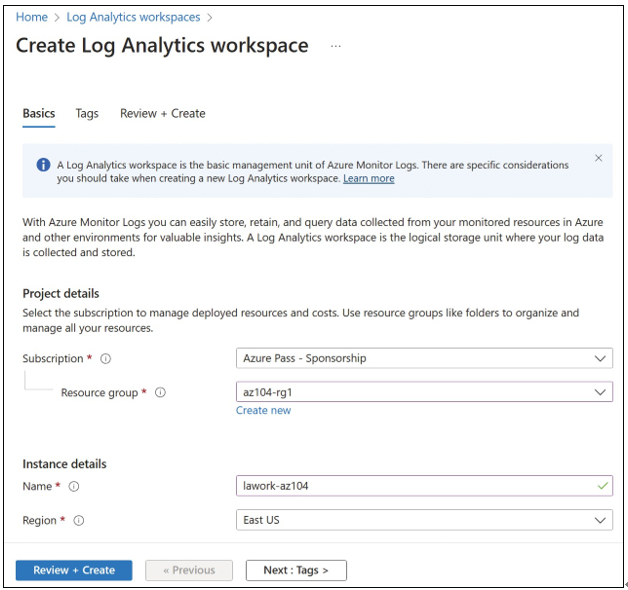
FIGURE 5-7 Log Analytics workspace configuration
Note that Log Analytics is not available in all regions. To select an appropriate region, see the Azure Products by Region documentation at https://azure.microsoft.com/global-infrastructure/services/.
To select the appropriate pricing tier, review the pricing documentation at https://azure. microsoft.com/pricing/details/monitor/. A new workspace will default to the Free tier, which includes 5 GB of log storage per month (31 days) with per-GB pricing and per-GB charges for additional storage and retention.
After a workspace has been provisioned, you must enable data collection and configure both resource and tenant logs to store their logs within the service.
To collect event and performance data from Windows and Linux machines, open the workspace and configure the agents and data collection rules, as shown in Figure 5-8. On the Agents blade, you can obtain the workspace ID, primary key, and secondary key for associating machines with the service through the monitoring agent. You can use this information when manually onboarding clients to the workspace.
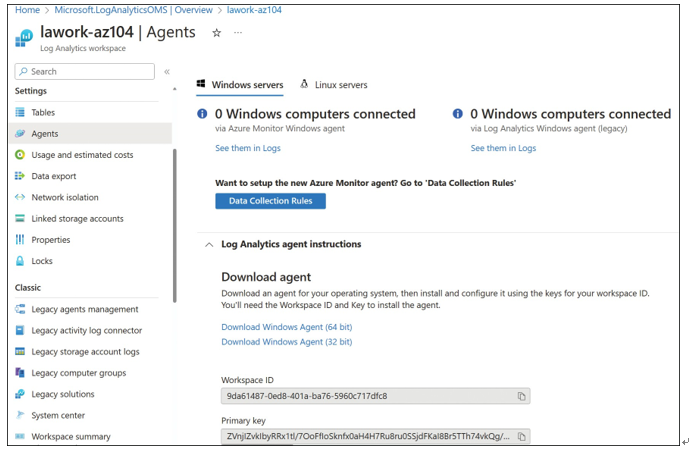
FIGURE 5-8 Log Analytics workspace agents
Click Data Collection Rules to configure the Windows event logs, Windows performance counters, Linux performance counters, Syslog, IIS Logs, custom fields, and custom logs.
To create a new data collection rule, click Create. The Basics tab of the Create Data Collection
Rule blade includes the following fields, as shown in Figure 5-9:
- Rule Name The display name of the rule
- Subscription The Azure subscription to create the rule in
- Resource Group The logical group for the resource
- Region The region that the rule is created in
- Platform Type Whether the rule supports Windows, Linux, or all platforms
Click Next: Resources to move to the Resources tab. This tab is where you define the source virtual machines to collect logs and metrics from. For Azure VMs, scale sets, and Arc-enabled machines that might be running elsewhere, the Azure Monitor Agent will be installed on the VM. For nonconnected VMs or client machines, the Azure Monitor Agent client will need to be installed on the target VMs.
On the Resources tab, click Add Resources. Place a checkmark next to the VMs that you want to enable data collection for, then click Apply, as shown in Figure 5-10.
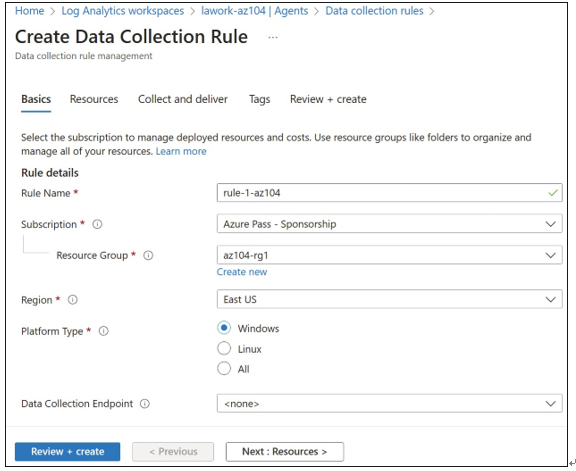
FIGURE 5-9 Basics tab on the Create Data Collection Rule blade
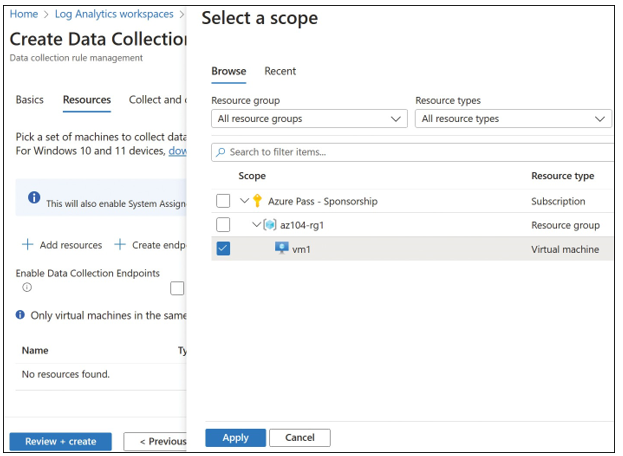
FIGURE 5-10 Add resources
Click Next: Collect And Deliver to move to the Collect And Deliver tab. On this tab, config- ure the data sources to collect. The available options here depend on which platform type was selected on the Basics tab. Click Add Data Source to add a source and destination for the rule, as shown in Figure 5-11.
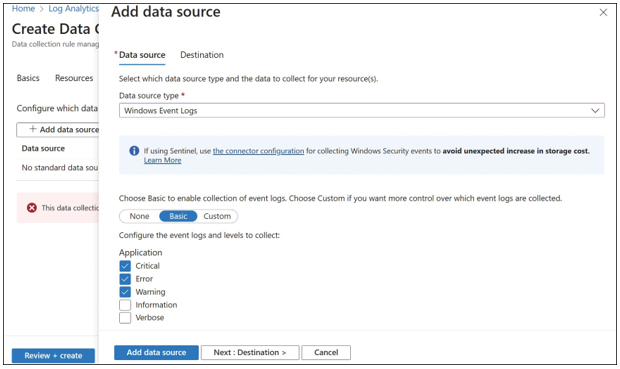
FIGURE 5-11 Add a data source
Click the Destination tab. By default, the selected metrics or logs will be sent to Azure Monitor Logs. Verify that the data is being sent to the Log Analytics workspace you created, as shown in Figure 5-12.

FIGURE 5-12 Add a data source destination
Click Add Data Source, then complete the Create Data Collection Rule blade to create the rule.
For the agent to send telemetry, you must also ensure that the required ports are available and the required URIs are whitelisted. The agent utilizes port 443 for all outbound communication. The required URIs for typical Azure deployments are shown in Table 5-1. Deployments in sovereign and government clouds will require additional changes.
TABLE 5-1 Azure Monitor agent ports and protocols
| Agent Resource | Ports | Direction | Bypass HTTPS Inspection |
| global.handler.control.monitor.azure.com | Port 443 | Outbound | Yes |
| <virtual-machine-region-name>.handler. control.monitor.azure.com | Port 443 | Outbound | Yes |
| <log-analytics-workspace-id>.ods. opinsights.azure.com | Port 443 | Outbound | Yes |
| management.azure.com | Port 443 | Outbound | Yes |
| <virtual-machine-region-name>.monitoring. azure.com | Port 443 | Outbound | Yes |
