Monitoring dashboards alone, even the most sophisticated ones, wouldn’t be enough for system administrators as they would have to monitor them 24/7 looking for various anomalies. That is why Google Cloud Monitoring provides alerting capabilities for the following use cases:
• User notifications – Used to notify admins when metrics exceed a certain threshold or when certain conditions are met. Administrators can use this feature to prevent potential issues proactively. For instance, if the CPU usage of a VM instance increases unexpectedly, it’s advisable to investigate it as it could be due to a coding bug or ransomware attack. This preemptive approach can help avoid problems before they occur.
• Autoscaling – You can use metrics exported from your application to auto-scale its underlying Managed Instance Group (MIG). The autoscaling feature will adjust the number of instances in response to a signal (such as CPU usage or latency) from your metrics. This feature automatically adjusts the number of instances based on metrics such as CPU usage or latency, eliminating the need for manual monitoring and modifications.
• Uptime checks – With uptime checks, you can monitor the availability of internet-accessible URLs, VMs, APIs, or load balancers. Probes placed around the globe continuously send requests to a target that you can configure and report its responses. As a result, you can create alerts based on failed uptime checks and get paged when your service is down.
Let’s take a closer look at the first use case and examine the various ways in which a user can receive alerts and how to configure a CPU-usage-based alert for selected VM instances.
To create alerts based on metrics, you need to specify how Google Cloud Monitoring should notify you. You can configure it under the Alerting section by selecting the Edit Notification Channels option. You can use the following options for your notifications: email, SMS, webhook, Pub/Sub, Slack, and PagerDuty. If you are using the Cloud Console mobile app to manage Google Cloud resources from your iOS or Android device directly, you can also use it as your notification channel.
Notification channels are not mandatory, but the alternative is that alerts will only be displayed in the Google Cloud Console, and you will have to monitor the Alerting dashboard continuously.
When notification channels are set, you need to complete the following steps to create your alert:
- In the Alerting section, select + CREATE POLICY.
- Create your first alert condition by selecting a metric from the metrics explorer. For example, to create an alert based on CPU usage for VM instances, you can select VM Instance and from the Instance section, select CPU usage, as shown in the following screenshot:
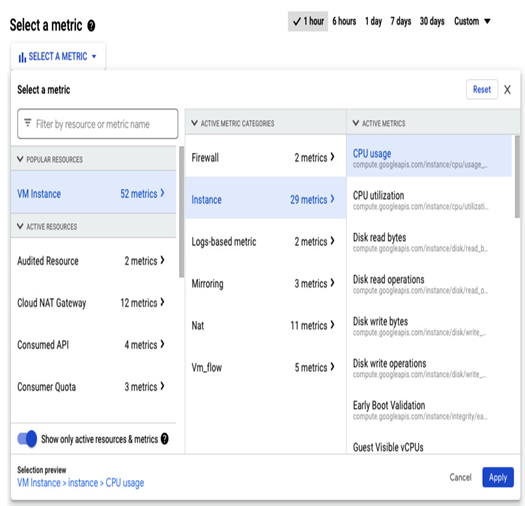
Figure 11.8 – Example view on VM Instance metrics explorer
- Add a filter if you want to create an alert for a specific subset of resources – for example, for VMs with a particular name or running in a specific region. This setting is optional.
- Select the minutes or hours option in the rolling window or provide a custom value. This parameter and the rolling window function describe how the threshold will be calculated. For example, when we set the rolling window to 10 minutes and the function to mean, a mean value for the duration of 10 minutes will be calculated. Other possible functions are, among others, min, max, count, sum, and percentage. Click Next to confirm your selection.
- The next step is to configure the trigger for the alert. For the threshold-based triggers, you can specify whether the alert should be fired for the following:
• Every violation
• A percentage of violations
• A number of violations
You must also specify whether the threshold position is above or below the threshold value. Once you select the threshold, it will appear on the chart on the right-hand side, and you will be able to verify how the value you provided corresponds to the situation from the selected time.
An alternative option to the threshold value is the absence of a metric. It gets triggered when metrics are absent for a selected period.
The last step in this section is to provide the condition name (if you want to use multiple conditions, a name would be beneficial) and confirm the settings by clicking Next:
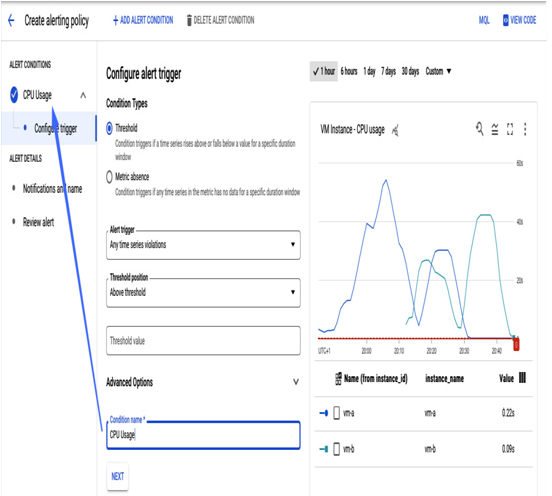
Figure 11.9 – Alert condition’s view
- You can create more alert conditions by selecting +ADD ALERT CONDITION. It is possible to create advanced scenarios with a multi-condition trigger, where you get a single alert when a subset of conditions happens simultaneously – for example, the VM CPU value exceeds 50%, and at the same time, the memory utilization reaches 80%:
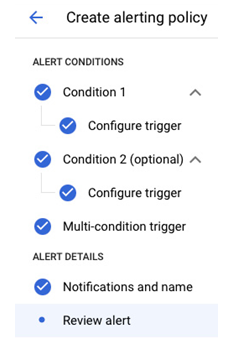
Figure 11.10 – Multi-condition view
In the Notifications and name section, select your notification channels. After the alert is triggered, you will not only be notified via selected channels but an alert will also be shown in the Alerting section in the Google Cloud Console. You can specify how long an unattended alert should be visible in your Console in the Incident autoclose duration section:
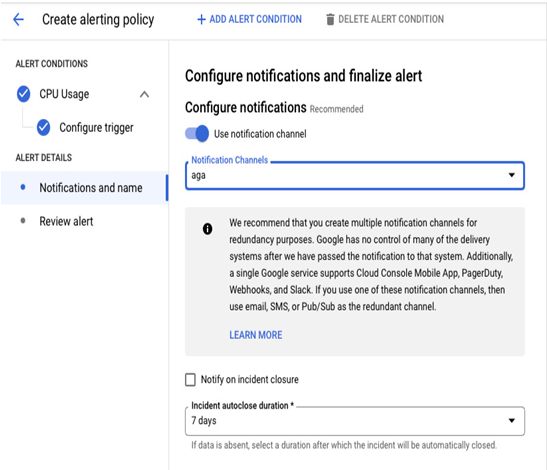
Figure 11.11 – Notification and name view
- The Notifications and name section also includes an optional text field to provide instructions and the steps an operator can follow once this alert is triggered:
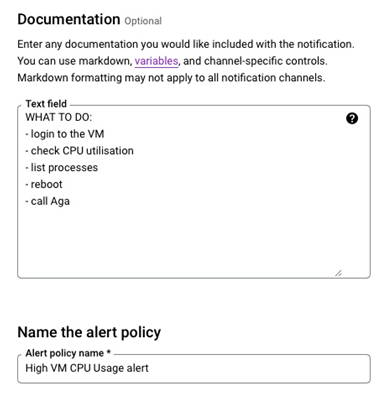
Figure 11.12 – Additional instructions that can be provided for an alert
- The last step in the Notifications and name section is to give the name for this alerting policy that will be visible in the Alerting section once an alert is fired.
- When you review your policy, save it. It will be enabled by default.
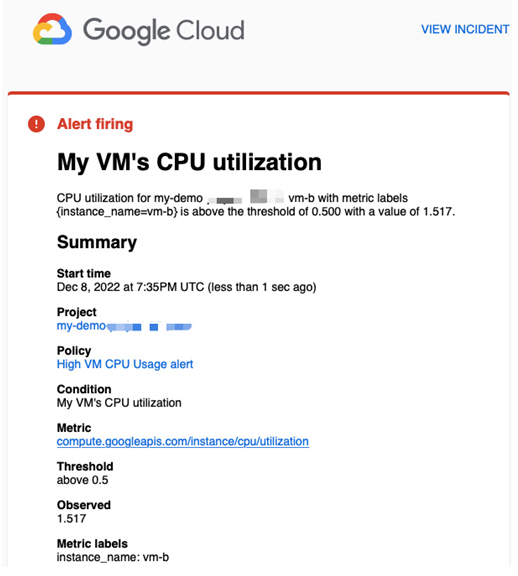
Figure 11.13 – An example of an email notification for an alerting policy
When an alert is triggered, Google Cloud Monitoring will notify you of the issue through the designated notification channels. As shown in Figure 11.13, you may receive a similar email notification about the CPU utilization of a VM.
