The second part of the chapter about implementing compute solutions using Google Kubernetes Engine (GKE) focuses on operations such as cluster, node pool, Pod, and Service management.
The following topics are covered:
- Cluster operations
- Node pool operations
- Pod management
- Service management
- GKE logging and monitoring
In the previous chapter about GKE, we learned how to create clusters in Standard and Autopilot modes. In this chapter, we will focus on the operational tasks of GKE.
After the first containerized application deployment, we will focus on Google Kubernetes management. Not only will we modify our clusters, but we will view resources and delete them as well. By performing those operations, we learn and memorize the steps needed to perform those activities and prepare for future use of GKE and containers.
Before we can perform any operation on a GKE cluster, we need to gather information about the existing cluster state, its configuration, and the resources available to us. This information will help us to understand the cluster and ensure that our operations are successful.
There are a number of ways to gather information about a GKE cluster. One way is to use the kubectl command-line tool. The kubectl get nodes command will list all nodes in the cluster, and the kubectl get pods command will list all Pods in the cluster.
Another way to gather information about a GKE cluster is to use the Kubernetes Dashboard. The Kubernetes Dashboard is a web-based user interface that allows us to view and manage our GKE cluster.
Once we have gathered information about the existing cluster state, we can then begin to perform operations on the cluster. For example, we could add or remove nodes, change the Kubernetes version, or allocate more resources to certain Pods.
Cloud console
The initial Cloud console view of a cluster shows the following information located on the first tab, OVERVIEW:
- Cluster status
- Name
- Location
- Mode
- Number of nodes
- Total vCPUs
- Total memory
- Notifications
- Labels
More detailed information about the cluster is available when we click on a particular tab.
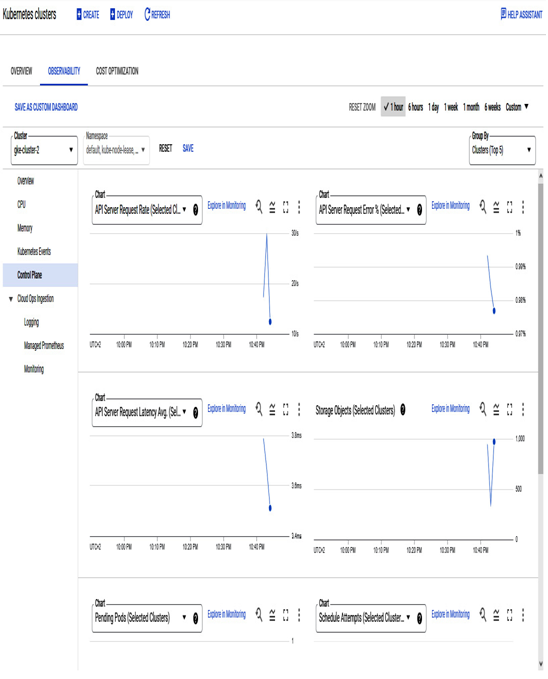
The second tab, OBSERVABILITY, contains summarized information about all clusters, and there is a possibility to drill down into a specific cluster if needed:

Figure 6.1 – OBSERVABILITY tab from the main GKE page
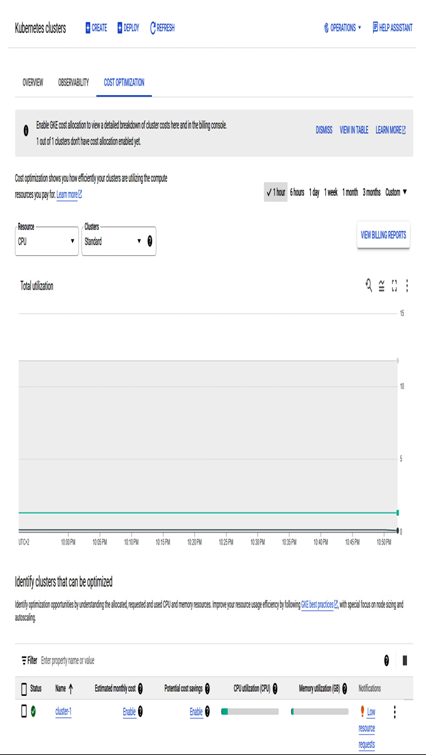
Finally, the third tab, COST OPTIMIZATION, lets us view cost optimization recommendations from Google Cloud:

Figure 6.2 – COST OPTIMIZATION tab from the main GKE page
Having overall information, we can dig into existing clusters. To view detailed information, we need to click on the desired cluster. The information is split into four sections, as follows:
- Details
- Nodes
- Storage
- Logs
The Details section is dedicated to the whole cluster, where we can see information divided into the following sections:
- Cluster basics
- Automation
- Networking
- Security
- Metadata
- Features
We encourage you to check each section as the information is very detailed.
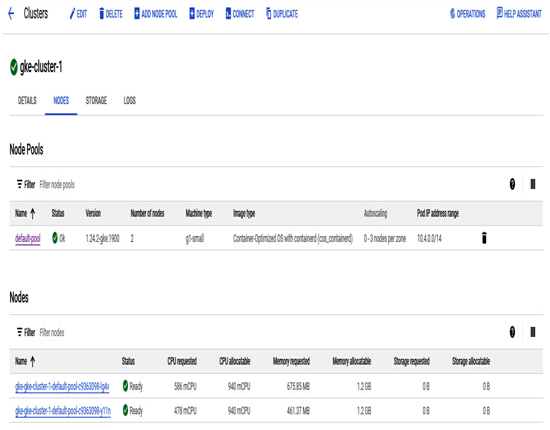
In the NODES tab of a specific cluster, we can drill down into Node Pools and Nodes. We see details about node performance metrics and a summary of node pools:

Figure 6.3 – Node pool summary overview
