Interpret metrics in Azure Monitor
Recall that metrics are the numerical values that are output by resources and services within Azure. Metrics are available for a number of Azure resources, but not all resources support metrics at this time.
Metrics includes platform metrics, which are created by Azure resources and made available in Azure Monitor for querying and alerting. You can also query application metrics from Application Insights if the service is enabled and you have instrumented your applications— regardless of whether that application is hosted on a virtual machine or even in a PaaS service, such as Azure App Service. When using a PaaS service such as App Service, you can retrieve some data without additional instrumentation. Virtual machines in Azure can also push custom metrics to the monitor service using the Windows Diagnostic extension on Windows servers and with the InfluxData Telegraf Agent on Linux VMs. There is also an opportunity to push custom metrics from other sources through a REST API.
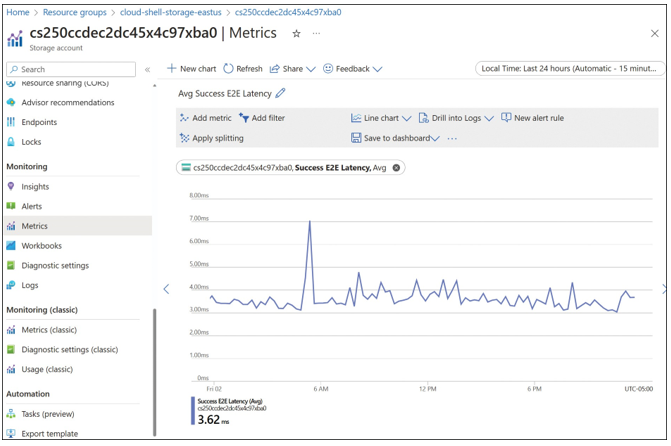
Figure 5-2 shows an example of a metrics chart displaying the end-to-end latency for a storage account.


FIGURE 5-2 Azure Metrics
Azure metrics are collected at one-minute intervals (unless otherwise specified) and are identified by a metric name and a namespace (or category). Most Azure metrics are retained for 93 days within Azure Monitor, but there are notable exceptions listed below:
Guest OS metrics
- Classic guest OS metrics
- Collected through diagnostic extensions and sent to an Azure storage account.
- Retention period of 14 days.
- Guest OS metrics sent to Azure Monitor metrics
- Monitored by Windows diagnostic extensions or the InfluxData Telegraf agent and routed to an Azure Monitor data sink.
- Retention period of 93 days.
- Guest OS metrics collected by Log Analytics agent
- Collected by the Log Analytics agent and sent to a Log Analytics workspace.
- Retention period of 31 days. This retention period can be extended for up to two years.
- Application insights log-based metrics
- Log-based metrics are translated into log queries.
- Retention period of 90 days.
EXAM TIP
For longer-term retention, metrics can optionally be sent to Azure Storage for select resources and retained up to the configured retention policy or the storage limits of the account. They can also be sent to Log Analytics with a default retention period of 31 days.
As metrics are collected, each metric has the following properties:
- The time the value was collected
- The type of measurement the value represents
- The resource with which the value is associated
- The value itself
Metrics can be one-dimensional or multidimensional with up to 10 dimensions. A nondi- mensional metric can be thought of as the metric name, and the value of the metric output is collected by the Monitor service over time. A multidimensional metric (both from an Azure resource or a custom metric) includes the metric name and an additional name-value pair with additional data. For example, imagine a storage account with multiple blob containers where you need to track the consumption of storage by container. A nondimensional metric would provide only the total consumed storage for the blob endpoint in the storage account where a multidimensional metric would provide the consumption by container, as it has the additional data stored in the metric record.
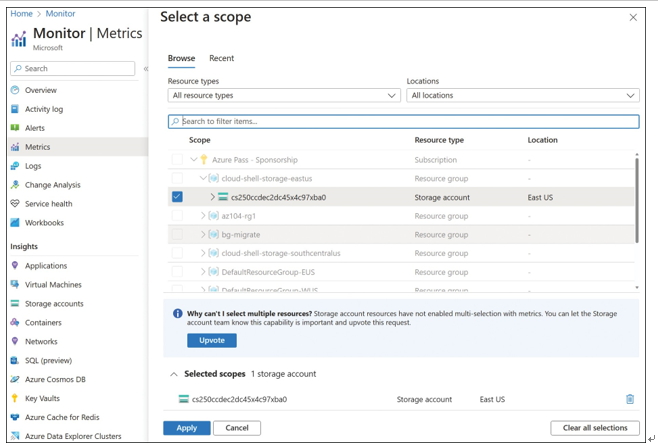
To interact with metrics from the Azure portal, search for Monitor. Then on the Monitor blade, click Metrics to open the Metrics blade. You will be presented with a blank chart. You can select the scope and required metrics to customize the metrics chart as needed, as shown in Figure 5-3.
To begin populating the chart, you need to select a metric. To select a metric, you must select a subscription and a resource group. Optionally, you can filter by resource type as well. When you select a resource, you can select a metric namespace (or category), a metric, and an aggregation if applicable. For example, to view the Ingress metric for a storage account,select the storage account from the Scope drop-down menu, choose Account from the Metric Namespace drop-down menu, choose Ingress from the Metric drop-down menu, and choose Sum from the Aggregation drop-down menu, as shown in Figure 5-4.

FIGURE 5-3 Azure Metrics Select A Scope blade

FIGURE 5-4 Azure metrics selection
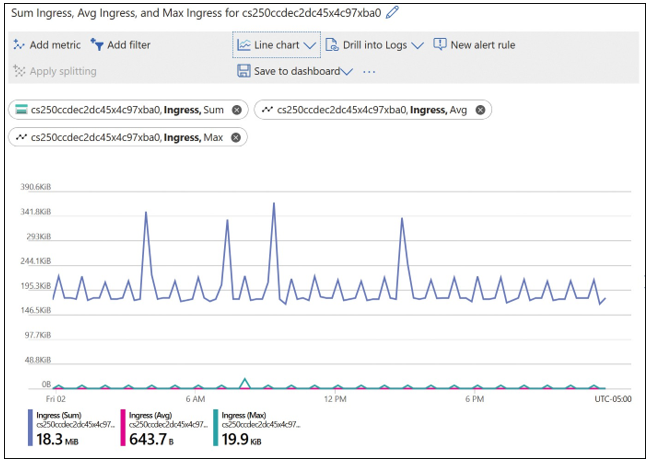
You can add multiple metrics to the chart, and you can even mix resources, namespaces, metrics, and aggregations as shown in Figure 5-5.

FIGURE 5-5 Azure multiple metrics selection for a resource
The chart will be rendered as you complete each resource selection. The period for the query can be changed up to the retention limits of the metrics service, and the chart can be rendered as a line chart (default), area chart, bar chart, scatter chart, or grid. An example of a line chart is shown in Figure 5-6.

FIGURE 5-6 Azure Metrics line chart
Note that you are not limited to charting resources from the same subscription. You can select metrics for resources of any available type across all the subscriptions to which you have access.
From the Metrics blade, you can also create a new alert rule based on the metric query that is visualized. If you need to perform a deeper analysis, you can export the raw metric data to Excel.

You also are not limited to creating a single chart. Click Add Chart in the Metrics Explorer to stack multiple charts, so existing charts can be cloned and then customized.

