With log-based metrics, you can configure metrics based on log entries from Cloud Logging (this service will be the subject of the next section) without any additional instrumentation. For example, if you want to monitor a specific behavior of your application and you know how this behavior is represented in logs, there is no need to use a monitoring API; you can configure a dashboard where the specific occurrence of a log entry is parsed and monitored.
Let’s look at an example application. It creates a log entry, Application Restarted, every time a specific process fails and is reloaded. We can create a simple query in Logs Explorer to list this specific entry. The following figure shows that the restart incident happens quite frequently.
You can create log-based metrics from Logs Explorer directly. There is a Create metric option in the same line as Histogram. Alternatively, you will find Log-based Metrics in the Logging section in the menu on the left:
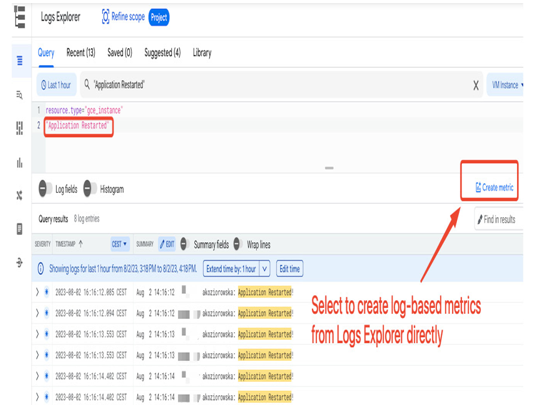
Figure 11.17 – Logs Explorer showing selected log entries
The log-based metrics feature allows you to create metrics that will be later visible in Metrics Explorer in the Monitoring section. There are two types of metrics:
- Counter metrics: These are used to track the number of events occurrences, and can be used to count how many times a particular error occurred.
- Distribution metrics: These are used to extract numeric values from logs, and can be used to extract regular expressions and numeric values such as the latency of an application.
In our example, we will select the option to count the number of entries matching a chosen filter. We will also provide the metric’s name, description, and units.
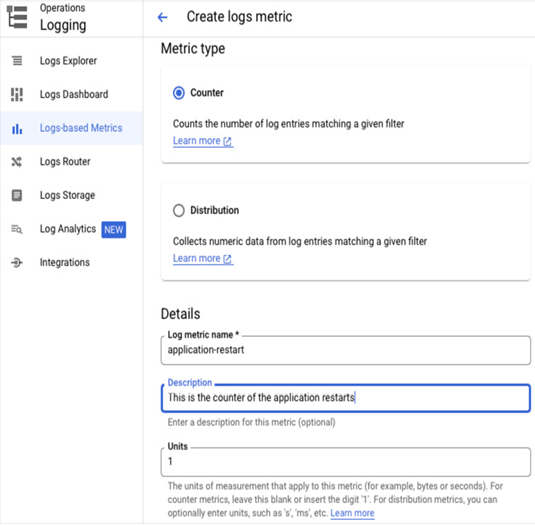
Figure 11.18 – Logs-based metrics configuration
In the Filter section, we need to specify what logs we want to monitor and how we want to parse them. We will use the instance name, type, and text from the log entry in this example:
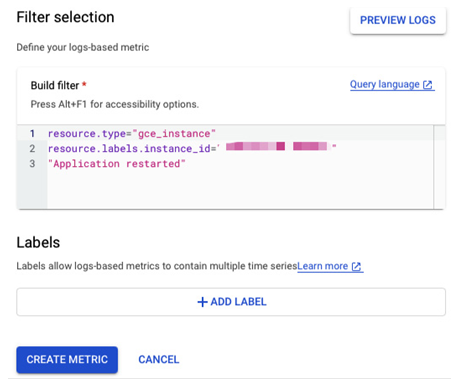
Figure 11.19 – The continuation of logs-based metrics configuration
You can build complex filters that count certain text occurrences and parse the logs to ingest certain values or array types. More information on the Logging query language that is used for building such filters can be found at the following link: https://cloud.google.com/logging/docs/view/logging-query-language.
Once our metric is created, it can be found in Metrics Explorer (initially introduced in Figure 11.8) under the /logging/user section:
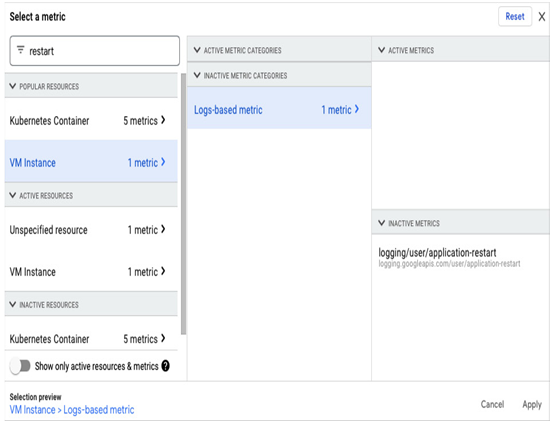
Figure 11.20 – Logs-based metrics in Metrics Explorer
The next step is to create a dashboard using the newly created metric. The parameters we need can be defined in the ADVANCED section – no preprocessing and grouping, count as an alignment function, and a 1-minute period:
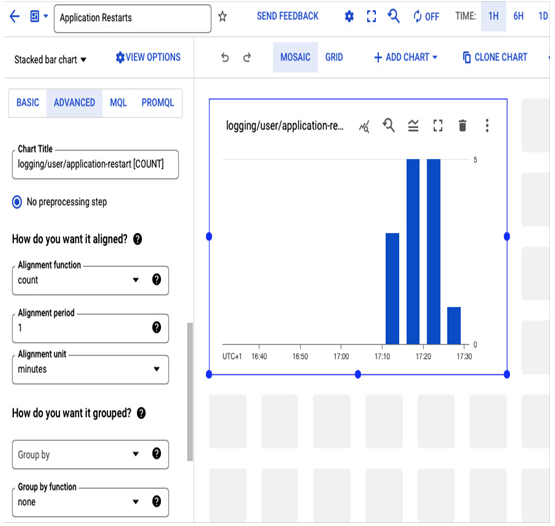
Figure 11.21 – Creating an advanced chart that counts log entry occurrences
Once the dashboard is saved, it can also be used to create alerts when the counters exceed a certain threshold. The alert configuration was explained earlier in this chapter. In the following screenshot, there is an example of an alert configured every time an application has two restarts in a minute:
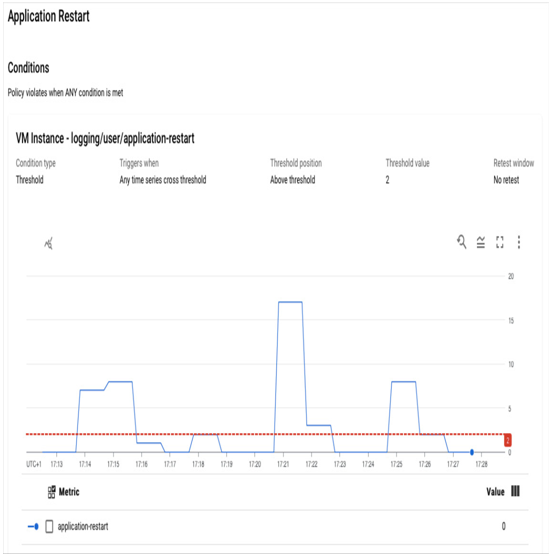
Figure 11.22 – Alert threshold set up on log-based metrics
When creating a log-based alert, consider that there can be a delay between when an error happens for your application and when enough errors are aggregated in the metrics to trigger a notification.
