Mastering Reports
Reports give you access to your Salesforce data and can be used as an important metric for your company’s business. With reporting, you can look at all the open cases and see which agent is taking longer to close a case (thereby understanding whether you need to share internal knowledge to make users more productive). With reporting, you can instantly look at ongoing opportunities and find out who is closing more deals. Also, reporting helps you look at how many leads have been created but not converted into customers. In summary, reporting lets you have a deeper look at what’s going on in your organization. This is why mastering reporting is a crucial skill for any good administrator.
In this chapter, we’ll cover the following topics:
- How to build, format, and chart reports
- How to track historic values on reports
- Define custom report types to shape reports on business needs
- How to filter reports and subscribe to a scheduled run
Building reports
Reporting is at the core of your company’s strategy: being able to examine data with infinite formats and display combinations makes us aware of what’s happening and what may be the outcome of our company’s business, whether that’s talking about service support or opportunities that have been sold (we’ve already talked about forecasting, which is one way of reporting on opportunities).
We’re not going to explain every single feature about reporting in this chapter since you will already be familiar with the basic concepts of this important feature. Also, if you are a developer, you may not be very enthusiast about deepening your reporting knowledge. You may think that this is not as fun or creative as developing but, believe me, creating reports can be creative as well.
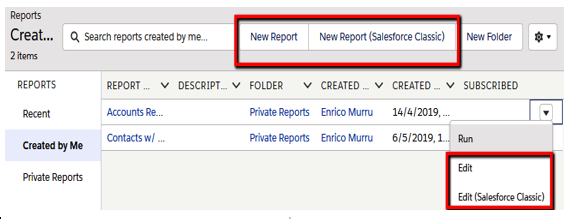
To build a report, we have to go to the Reports tab. If we are on Lightning Experience, for example, we can create reports with the Lightning Report Builder or the Classic Report Builder, as shown here:

Different ways to create/edit reports
At the time of writing (Summer 2019), these are the main difference between the two tools:
- When grouping data, you need to select the report format (such as tabular, summary, or matrix report) before grouping, while in Lightning Experience, the format is automatically selected (but you can always change it afterward).
- The row limit filters and dashboard settings menu features are not available on the Lightning Report Builder.
Don’t panic: if something is not available on the Lightning Report Builder, edit the report on the Classic Report Builder (you can switch between the two builders at any time).
Also, remember that, as of Winter 2020, the Lightning Report Builder is in beta version and may be subject to unexpected behavior when creating/editing reports.
When creating a new report, the first thing you’ll need to select is a report type, which identifies the kind of data you are going to report on. We have standard and custom report types: the first group is built-in and depends on standard objects, while the second group can already be on our CRM (built-in but customizable) or created by other administrators (with both standard and custom objects).
