You can also use built-in charts and out-of-the-box metrics to build customized views to have all the services that build your application in one dashboard.
In the Dashboards overview, select + CREATE DASHBOARD, provide its name, and as a next step, drag and drop a metric you need and rearrange or resize it to fit nicely into your dashboard. You can later edit and adjust your dashboard after observing the metrics for some time, so they show only the relevant data.
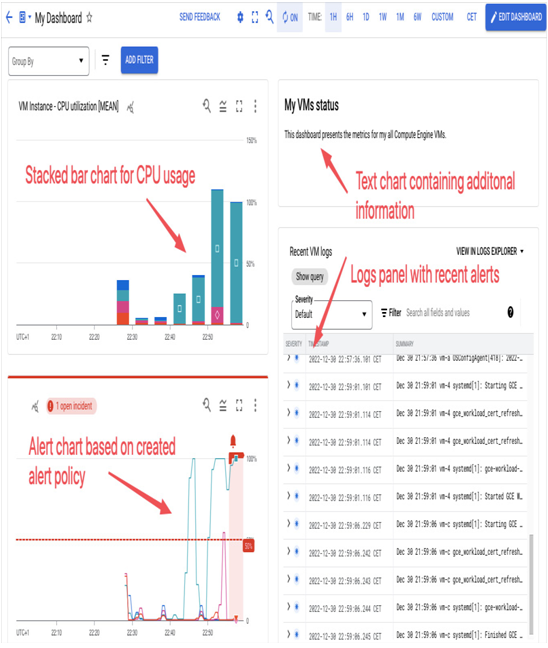
Let’s look at the example of such a customized dashboard. Its purpose is to have a single dashboard to view resource usage, alerts, and logs for Compute Engine VMs. It consists of four charts – a stacked bar chart to present their CPU utilization, a small text chart that could be used to add more details about monitored objects, an alert chart that shows whether a preconfigured threshold for CPU is exceeded, and a large logs panel showing recent logs from the VMs:

Figure 11.3 – Example of a customized monitoring dashboard based on out-of-the-box metrics
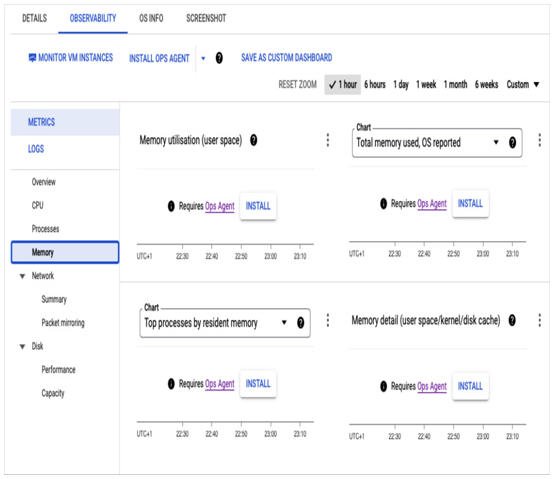
Once you start exploring various charts, you will soon notice that although all the data seems to be presented for services such as GKE or App Engine, some of the Compute Engine charts are empty.
Specifically, you won’t find memory metrics for your VMs unless you install an additional component called Ops Agent. Keep in mind that this only applies to Compute Engine VMs; GKE and App Engine already have built-in agents for collecting metrics, so you don’t need to install anything extra for those services.

Figure 11.4 – Some of the metrics require Ops Agent installation
Ops Agent is a collectd-based daemon that collects telemetry data from Compute Engine VMs for cloud monitoring and logging services. It collects data for supported operating systems and applications from the inside of a VM. You can install it via the Google Cloud console or a command line.
The command to install the agent on the Linux VM is as follows:
curl -sSO https://dl.google.com/cloudagents/add-google-cloud-ops-agent-repo.sh
sudo bash add-google-cloud-ops-agent-repo.sh –also-install
You can check whether it is running using the following command:
sudo service google-cloud-ops-agent status
When you create a Compute Engine VM, you have the option to attach either a default or a dedicated service account to it.
The Ops Agent uses this service account to interact with the Logging and Monitoring services, so it requires permission. To ensure proper functionality, assign the service account the following roles:
- For Monitoring, use Monitoring Metric Writer
- For Logging, use Logs Writer
To install the agent on multiple VMs, use Agent Policies. This feature automates the installation and upgrading of a fleet of Ops Agents. For instance, if you have a large number of Debian v10 Compute Engine instances, you can create a policy to install Ops Agent on all of them by attaching a label such as env: production to the instances in your project and enabling automated upgrades. To execute this, use the following gcloud command in Cloud Shell:
gcloud beta compute instances \
ops-agents policies create ops-agents-debian \
–agent-rules=”type=ops-agent,version=current-major,package-state=installed,enable-autoupgrade=true” \
–os-types=short-name=debian,version=10 \
–group-labels=env=production\
–project=my-project
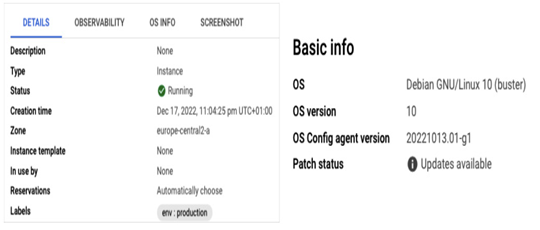
Once the policy is in use, any existing or newly created compliant VM with the env: production label, as shown in the following screenshot, will trigger the Ops Agent installation:

Figure 11.5 – An example of a VM with an env:production tag running on Debian v10, compliant with the “ops-agents-debian” policy
Let’s explore how the Agent Policy can be implemented in practice. The preceding screenshot is taken from the VM instances section in the Compute Engine menu. Clicking on any of the VMs will take you to a new page with more specific information about that particular VM. On the left-hand side, there is the DETAILS tab view, where you can see that this VM has the necessary label: env: production. On the right-hand side, the Basic info view shows that the required version of the Debian operating system is 10, which should trigger the Ops Agent installation through the Agent Policy.
The following screenshot shows a log extract (Cloud Logging will be discussed later in this chapter) confirming that ops-agent-policy was activated for this VM and that the Ops Agent was installed successfully.

Figure 11.6 – The Agent Policy installs Ops Agent on compliant VMs
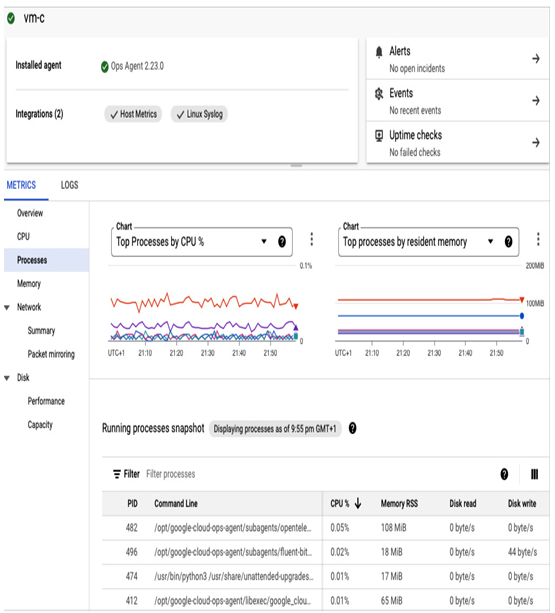
Once Ops Agent is installed, Google Cloud Monitoring detects it and collects more detailed information, such as information about memory usage and running processes. For example, the following screenshot shows previously empty dashboards that are now populated with data once Ops Agent is installed:

Figure 11.7 – VM processes metrics available after Ops Agent installation
Now that we know how to set up and adjust monitoring of our services, we can look at the dashboards and analyze, for example, how many resources they are using. But do we have to watch dashboards constantly? In the next section, we will see how this process can be automated.
