When working with Google Cloud’s operations suite products described in this section (Debugger, Profiler, and Trace, but also Logging and Monitoring, which were presented earlier in this chapter), it is essential to know what the permissions model looks like. For example, what role can be assigned to a user that wants only to view dashboards?
In the following table, you can find predefined roles that a user can leverage to access and edit dashboards and logs for each service described in this chapter:
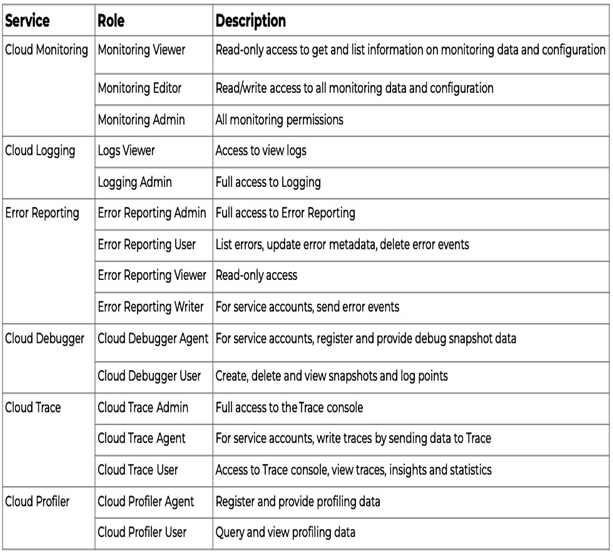
Table 11.2 – Predefined IAM roles for Google Cloud’s operations suite services
Note that the mentioned observability services usually have a predefined Viewer role that allows for read-only access to dashboards, and an Admin role that provides full access to resources.
You can monitor, in real-time, the status of Google Cloud services organized by by-products or regions at the following address: https://status.cloud.google.com.
The following screenshot shows the status dashboard of Google Cloud services. You can see that at the time of taking the screenshot, additional status information was published for the Cloud Firestore service in all regions.
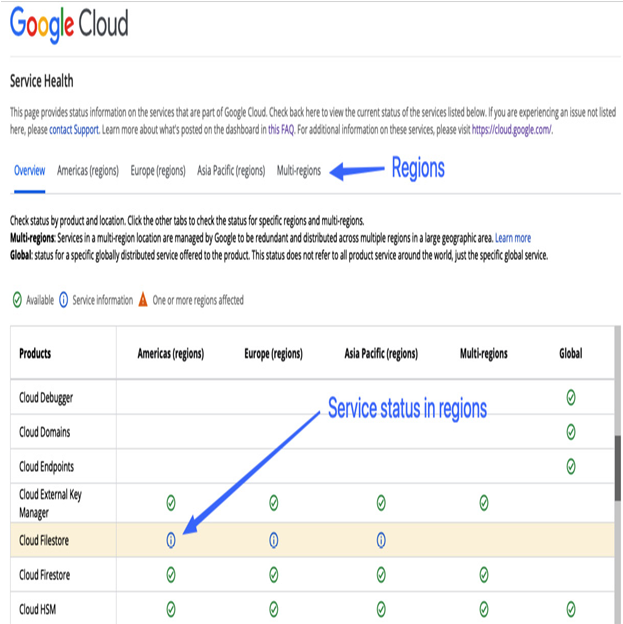
Figure 11.45 – Viewing the Google Cloud Service Health dashboard
Your Cloud Console dashboard also has a Google Cloud Platform status card. If an issue you are experiencing is listed there, monitor the dashboard for incoming messages. Otherwise, if all services are operational, your issue is most likely related to your environment and is not global, so you should open a support case to get help.
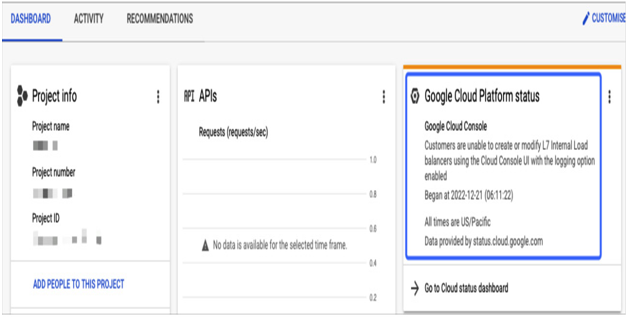
Figure 11.46 – Viewing the Google Cloud Platform status in the Cloud Console dashboard
The preceding screenshot shows the Google Cloud Platform status with potential issues with the Google Cloud Console. This section is located by default in the top-right corner of the DASHBOARD view although this view can be customised, if needed.
Estimating costs with the Google Cloud Pricing Calculator
Suppose your project team needs to determine the cost of an application that utilizes Compute Engine, GKE, Google Cloud Storage, and Interconnect to your on-premises data center. This is to secure a budget for the project. Instead of studying the pricing documentation for each service, you can quickly calculate the estimate using the Google Cloud Pricing Calculator.
You can access the Google Cloud Pricing Calculator web app through this link: https://cloud.google.com/products/calculator.
The calculator is designed to simplify estimating a monthly bill for even very complex architectures that utilize various Google Cloud services. It is organized by product, starting with Compute Engine and GKE, moving on to databases such as CloudSQL and Cloud Bigtable, networking options such as Interconnect and VPN, serverless services such as Cloud Run, and storage options such as Google Cloud Storage or Filestore. Users can customize each product’s components and provide detailed configurations, including class, tier, size, and estimated traffic. Once the configuration of every service is complete, you simply click ADD TO ESTIMATE and the calculator will instantly provide a monthly cost for all the included services.
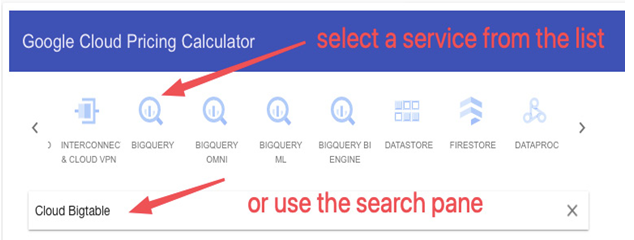
Figure 11.47 – Google Cloud Pricing Calculator supports various Google Cloud services
Here’s an example of calculating the monthly cost for a Compute Engine VM that will be used for a web service running on Ubuntu in the europe-central-2 region, 24/7. This VM requires a 100-GB boot drive and needs to be available from the internet.
In the SERVICE SELECTION pane of the Pricing Calculator, shown in Figure 11.48, find a Compute Engine service and provide details such as the number of VMs (1), an operating system (Debian), an instance type (depending on the web server requirements – in this case, we will leave the default E2 type).
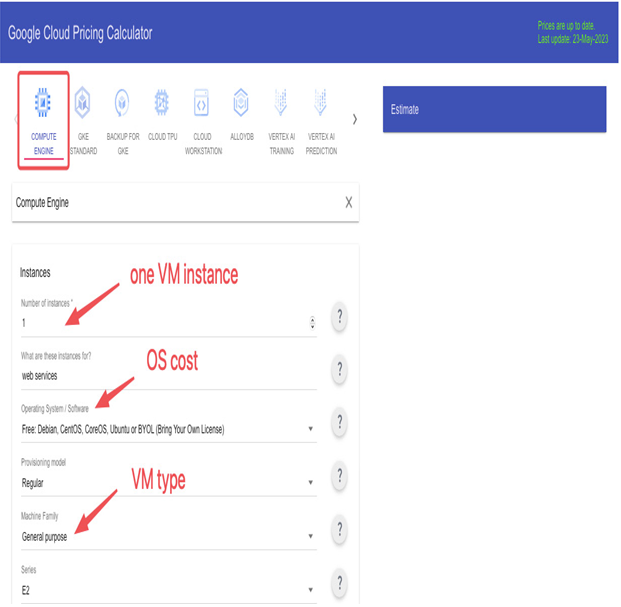
Figure 11.48 – Preparing a price estimate for a VM instance
Select europe-central2 as the region and choose the Balanced persistent disk option for the boot disk with 100 GB of storage, as shown in Figure 11.49. Additionally, specify the duration for which you plan to run the VM as 24 hours, and 7 days per week. Also, add one public IP address. Leave all other values as their defaults.
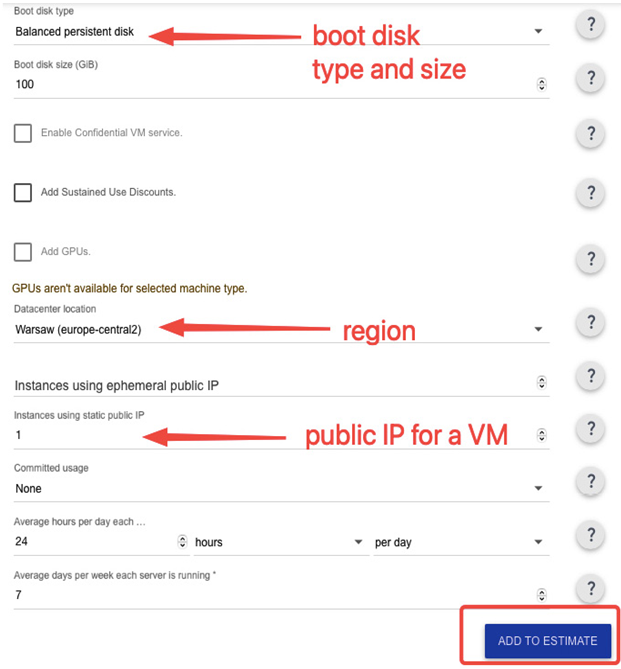
Figure 11.49 – Preparing a price estimate for a VM instance (continuation)
Once you have entered all your required details, simply click on the ADD TO ESTIMATE button shown in Figure 11.49 to receive an accurate estimate of your monthly operating costs for the VM.
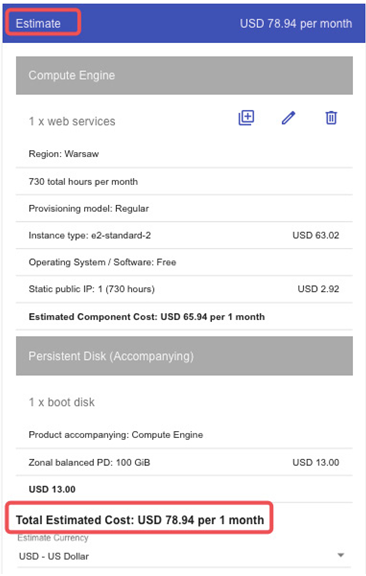
Figure 11.50 – Google Cloud Pricing Calculator final estimate for running a VM instance
Considering the settings provided, the Pricing Calculator generated two estimates for our Compute Engine VM. The first estimate is for the VM itself, which will be billed at a monthly rate of $65.94. The additional boot drive will also be charged at $13.00 per month. Consequently, the monthly cost to keep the web application running will be $78.94. Please note that the Pricing Calculator will automatically update the estimate if any changes or new services are added. You can add more Google Cloud services to this estimate to reflect the architecture you plan to run on Google Cloud.
If you’re interested in understanding the pricing for a particular service, you can find a comprehensive pricing list for Google Cloud services at https://cloud.google.com/pricing/list. Additionally, if you anticipate using services for a minimum of one year, you may be eligible for Committed Use Discounts (CUDs). For more information on CUDs, please visit https://cloud.google.com/docs/cuds.
Even though you may get fewer observability-related questions compared to the other services on the ACE exam, the Monitoring and Logging services are essential areas in your hands-on experience with Google Cloud. Initially, observability helps you better understand how Google Cloud services work. Later, when you run your applications in production, it will help you to improve customer experience and reduce costs.
To get the most out of observability, start with out-of-the-box dashboards, add agents for Compute Engine VMs to collect additional metrics, and create logs-based metrics and alerts. Next, centralize monitoring into a dedicated project or logs by aggregating sinks. Finally, use Trace, Profiler, and Debugger to optimize your application.
