Save a query to the dashboard
In addition to sample queries, you can browse the schema for the currently selected work- space. This is useful for determining the proper case for table and column names because KQL is a case-sensitive query language. You can save authored queries for later or mark them as favorites so they can be retrieved later using the query explorer (see Figure 5-17).
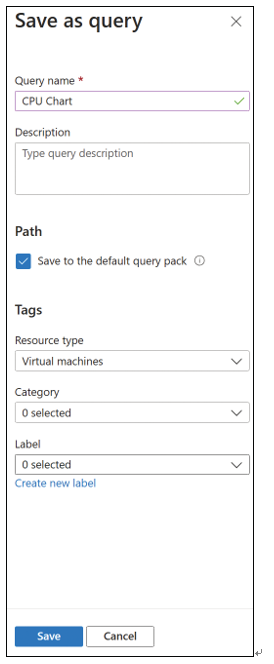
FIGURE 5-17 Save a query or mark it as a favorite
Interpret graphs
In the query explorer, you can also generate charts and graphs based on the log queries. In the output section, click Chart to see the graphical representation of query results. You can choose a display option from various categories (from column, bar chart, line, pie, or area). For one of the sample queries, the stacked bar chart is shown in Figure 5-18.
You can also adjust the query and the chart type. For example, a doughnut pie chart is shown in Figure 5-19.
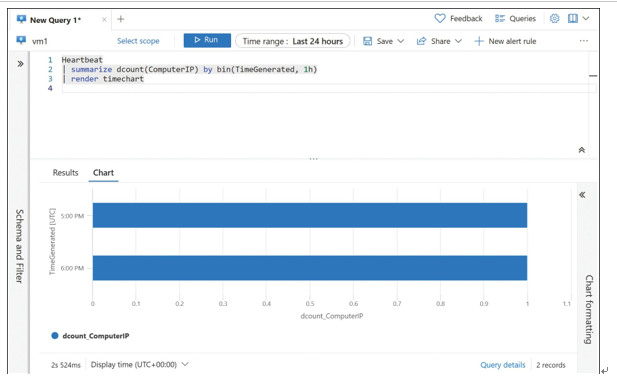
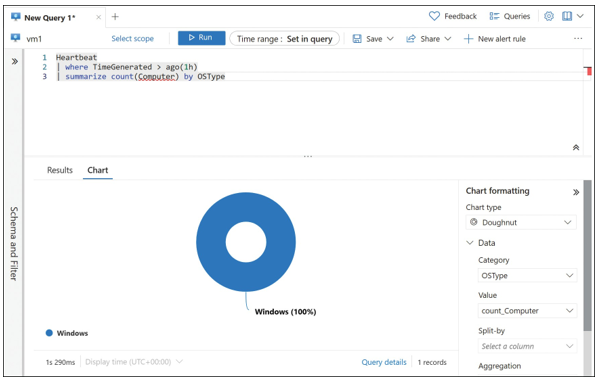
FIGURE 5-19 Doughnut pie chart
Set up alert rules, action groups, and alert processing rules in Azure Monitor
Alerts proactively notify you when important conditions are found in your monitoring data so you can identify and address issues before the users of your system notice them.
Azure Monitor brings a unified alerting experience to Azure, with a single pane of glass for interacting with metrics, the activity log, Log Analytics, service and resource health, and service-specific insights that provide out-of-the-box dashboards with visualizations and queries for
- Custom applications with Application Insights
- Virtual machines
- Storage accounts
- Containers
- Networks
- Key vaults You can choose from multiple notification options, including
- SMS
- Push notifications to the Azure mobile app
- Voice
- Integration with automation services
Alerts that are generated within Azure Monitor can invoke Azure Automation runbooks, Logic Apps, Azure Functions, and even generate incidents in third-party IT service management tools, such as ServiceNow.
Create and test alerts
To create an alert rule, open the Alerts blade (click Alerts from within the Azure Resource Configuration blade or browse to Azure Monitor in the Azure portal), click Create, and then click Alert Rules, as shown in Figure 5-20.

FIGURE 5-20 The Alerts blade within Azure Monitor
Alerts in Azure Monitor are centered on alert rules. Alert rules contain the following components:
- A target resource (or resource type)
- Conditional logic for the alert with criteria based on the available signals for the target resource
- An action group, or what should happen when the alert rule condition is met
- A name and description for the alert rule

Click Select Scope to pick the target for the alert, which determines the available signals, as shown in Figure 5-21.
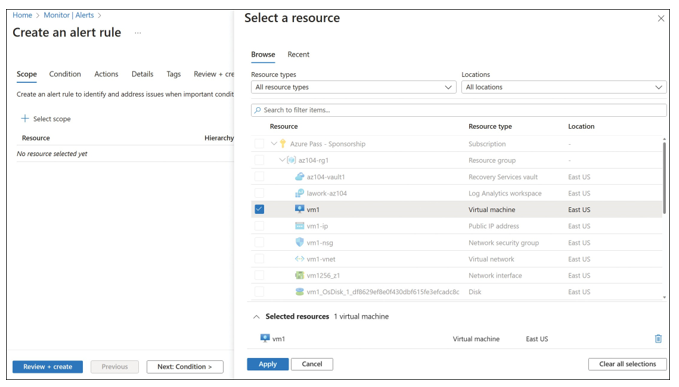
FIGURE 5-21 Create an alert rule
The target resource defines the scope and signals available for the alert. A target resource is an Azure resource that generates signals (such as metrics or the activity log) such as a virtual machine or storage account. The signal types available for monitoring vary based on the selected target (or targets, as you can select more than one target). The available signal types are as follows:
- Metrics
- Log search queries
- Activity logs
The next step is to configure the alert criteria by selecting the signal from the drop-down menu, as shown in Figure 5-22.
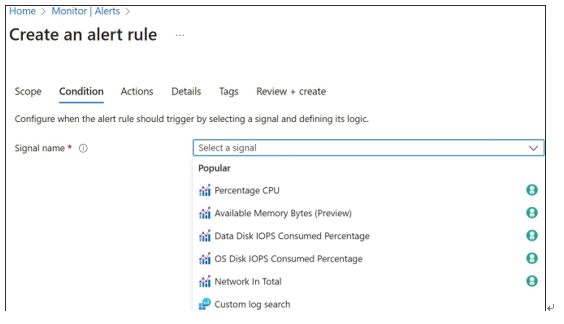
FIGURE 5-22 Azure Monitor alert rules conditions
