We already had a sneak peek into Cloud Logging when we built log-based metrics in the Cloud Monitoring section. Now, it’s time to explain how to view logs with Logs Explorer.
The upper section of Logs Explorer includes a Query pane with a time-range selector, an editor to build queries, a filter to narrow down a scope, and a search box where you can search across all log fields:
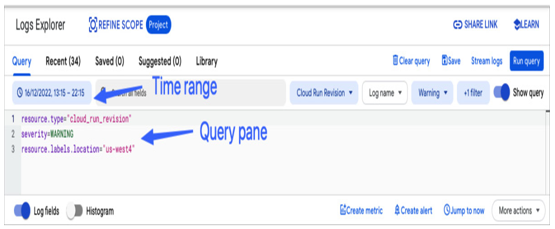
Figure 11.24 – Logs Explorer Query pane
On the left-hand side, a Log fields pane is updated according to the fields shown in log entries. It has a SEVERITY section, a RESOURCE TYPE or service section, and others that help narrow down the logging scope.
In terms of severity, each log entry is categorized based on the seriousness of the issue. The SEVERITY levels include Emergency, Alert, Critical, Error, Warning, Notice, Info, Debug, and Default. You can utilize these levels to refine your search.
For example, only Error logs will be listed if you select an Error severity level. If you select the VM instance resource type, the log output will be limited to Compute Engine VMs.
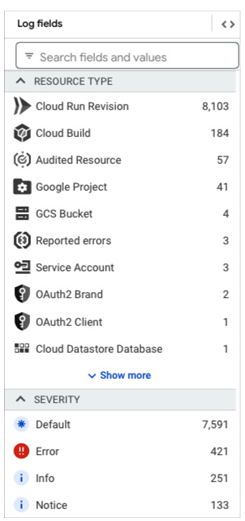
Figure 11.25 – Logs Explorer Log fields pane
In the center pane, you will find a Histogram section where the distribution of logs over time is visualized, as can be seen in the following screenshot. It will help you to look for trends in your system’s behavior or detect when a specific issue started.
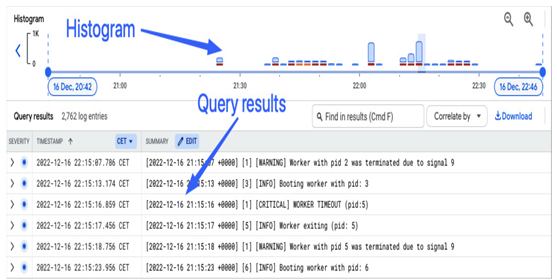
Figure 11.26 – Logs Explorer Histogram and Query results section
Under Histogram, there is a Query results pane where logs are listed. You can expand all nested fields in a selected log entry, show or hide similar ones, download logs, or save them to Google Drive.
Viewing specific log message details in Cloud Logging
If you are looking for a specific message in Cloud Logging to examine its content, you can start by listing logs of a certain severity coming from a specific resource in the Log fields pane. Once you select a time range in the Query pane to narrow your search, you can inspect the Query results pane. When you expand a log entry and select a field, you will see an option to show/hide matching entries:
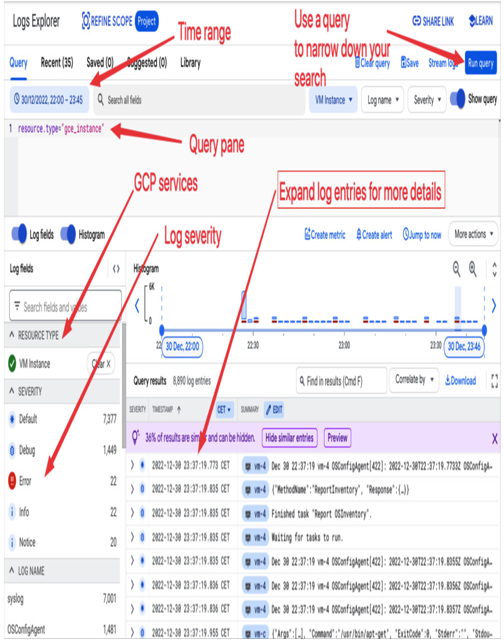
Figure 11.27 – Logs Explorer sections that help to narrow down a log search
Selecting Show/hide similar entries will populate a Query pane with a query that matches your request. The Query pane is where you can build more sophisticated logic that will narrow down your log search:
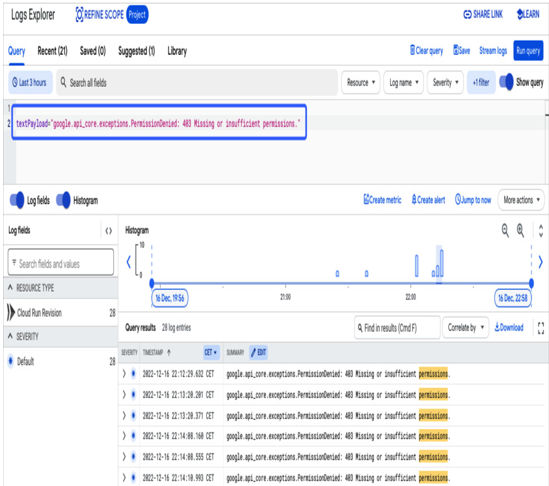
Figure 11.28 – Using a Query pane to narrow down a log search
Let’s look at the following screenshot. In the Query pane, there is a query that limits the log search to the Cloud Run service, showing only entries with the severity level of WARNING in the us-east4 zone and only the HTTP request with status of 400:
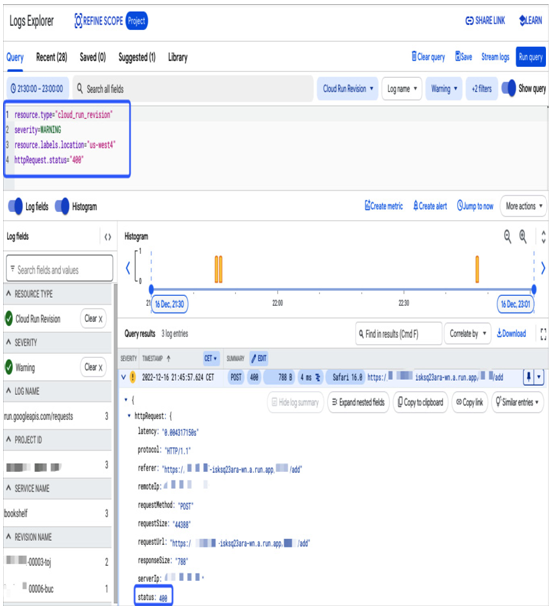
Figure 11.29 – Example query for logs related to HTTP service
Narrowing down a search scope will make your troubleshooting easier. But you may also want to limit the scope before sending logs to other destinations. In the next section, where we will learn how to configure log sinks; building filters to include specific logs will prove useful.
Please keep in mind that Logs Explorer is the ideal tool for troubleshooting and exploring log data. However, if you need assistance in creating insights and identifying trends, Google provides Log Analytics specifically for this purpose.
You can learn more about Log Analytics from this link:
https://cloud.google.com/logging/docs/log-analytics#analytics.
